Spaniard vs Hmong 3rd Grade
COMPARE
Spaniard
Hmong
3rd Grade
3rd Grade Comparison
Spaniards
Hmong
97.9%
3RD GRADE
87.9/ 100
METRIC RATING
136th/ 347
METRIC RANK
97.9%
3RD GRADE
80.3/ 100
METRIC RATING
142nd/ 347
METRIC RANK
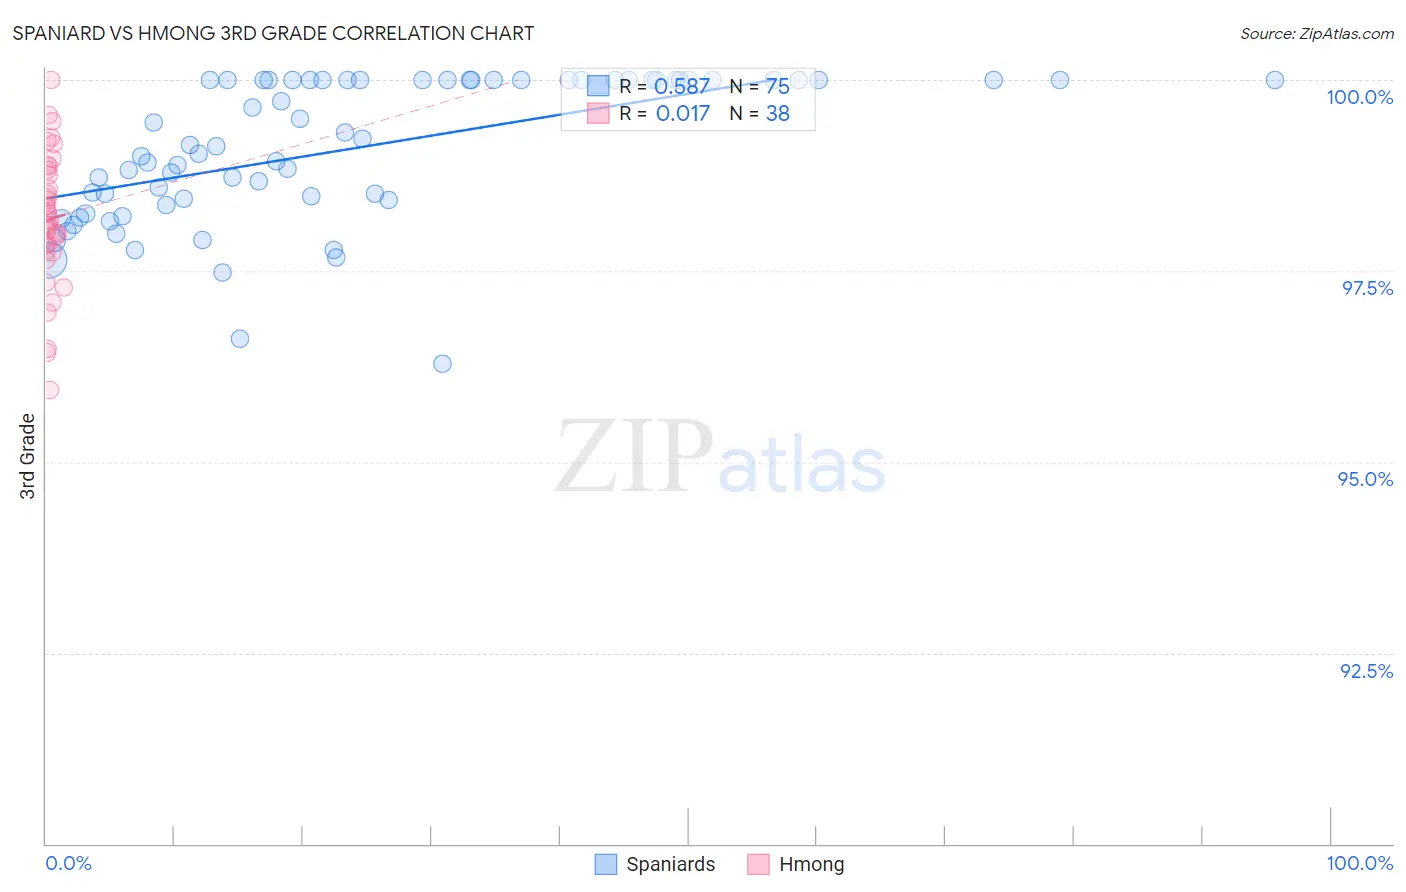
Spaniard vs Hmong 3rd Grade Correlation Chart
The statistical analysis conducted on geographies consisting of 443,544,503 people shows a substantial positive correlation between the proportion of Spaniards and percentage of population with at least 3rd grade education in the United States with a correlation coefficient (R) of 0.587 and weighted average of 97.9%. Similarly, the statistical analysis conducted on geographies consisting of 24,672,093 people shows no correlation between the proportion of Hmong and percentage of population with at least 3rd grade education in the United States with a correlation coefficient (R) of 0.017 and weighted average of 97.9%, a difference of 0.050%.
3rd Grade Correlation Summary
| Measurement | Spaniard | Hmong |
| Minimum | 96.3% | 95.9% |
| Maximum | 100.0% | 100.0% |
| Range | 3.7% | 4.1% |
| Mean | 99.1% | 98.2% |
| Median | 99.2% | 98.2% |
| Interquartile 25% (IQ1) | 98.4% | 97.8% |
| Interquartile 75% (IQ3) | 100.0% | 98.8% |
| Interquartile Range (IQR) | 1.6% | 1.1% |
| Standard Deviation (Sample) | 0.94% | 0.88% |
| Standard Deviation (Population) | 0.93% | 0.87% |
Demographics Similar to Spaniards and Hmong by 3rd Grade
In terms of 3rd grade, the demographic groups most similar to Spaniards are Cambodian (97.9%, a difference of 0.0%), Immigrants from Romania (97.9%, a difference of 0.0%), Immigrants from Bulgaria (97.9%, a difference of 0.010%), Immigrants from Hungary (97.9%, a difference of 0.010%), and Immigrants from Kuwait (97.9%, a difference of 0.010%). Similarly, the demographic groups most similar to Hmong are Filipino (97.9%, a difference of 0.0%), Burmese (97.9%, a difference of 0.0%), Immigrants from Greece (97.9%, a difference of 0.0%), Alsatian (97.9%, a difference of 0.010%), and Immigrants from Turkey (97.9%, a difference of 0.020%).
| Demographics | Rating | Rank | 3rd Grade |
| Immigrants | Serbia | 91.9 /100 | #129 | Exceptional 98.0% |
| Immigrants | Europe | 91.2 /100 | #130 | Exceptional 98.0% |
| Immigrants | Bulgaria | 89.1 /100 | #131 | Excellent 97.9% |
| Immigrants | Hungary | 88.8 /100 | #132 | Excellent 97.9% |
| Immigrants | Kuwait | 88.7 /100 | #133 | Excellent 97.9% |
| Seminole | 88.7 /100 | #134 | Excellent 97.9% |
| Cambodians | 88.1 /100 | #135 | Excellent 97.9% |
| Spaniards | 87.9 /100 | #136 | Excellent 97.9% |
| Immigrants | Romania | 87.9 /100 | #137 | Excellent 97.9% |
| Israelis | 86.6 /100 | #138 | Excellent 97.9% |
| Blackfeet | 86.3 /100 | #139 | Excellent 97.9% |
| Palestinians | 84.6 /100 | #140 | Excellent 97.9% |
| Immigrants | Turkey | 83.5 /100 | #141 | Excellent 97.9% |
| Hmong | 80.3 /100 | #142 | Excellent 97.9% |
| Filipinos | 79.9 /100 | #143 | Good 97.9% |
| Burmese | 79.6 /100 | #144 | Good 97.9% |
| Immigrants | Greece | 79.5 /100 | #145 | Good 97.9% |
| Alsatians | 78.3 /100 | #146 | Good 97.9% |
| Immigrants | Israel | 77.3 /100 | #147 | Good 97.9% |
| Immigrants | Moldova | 77.1 /100 | #148 | Good 97.9% |
| Immigrants | North Macedonia | 74.5 /100 | #149 | Good 97.8% |