South American Indian vs Yakama 5th Grade
COMPARE
South American Indian
Yakama
5th Grade
5th Grade Comparison
South American Indians
Yakama
97.0%
5TH GRADE
5.4/ 100
METRIC RATING
224th/ 347
METRIC RANK
94.8%
5TH GRADE
0.0/ 100
METRIC RATING
341st/ 347
METRIC RANK
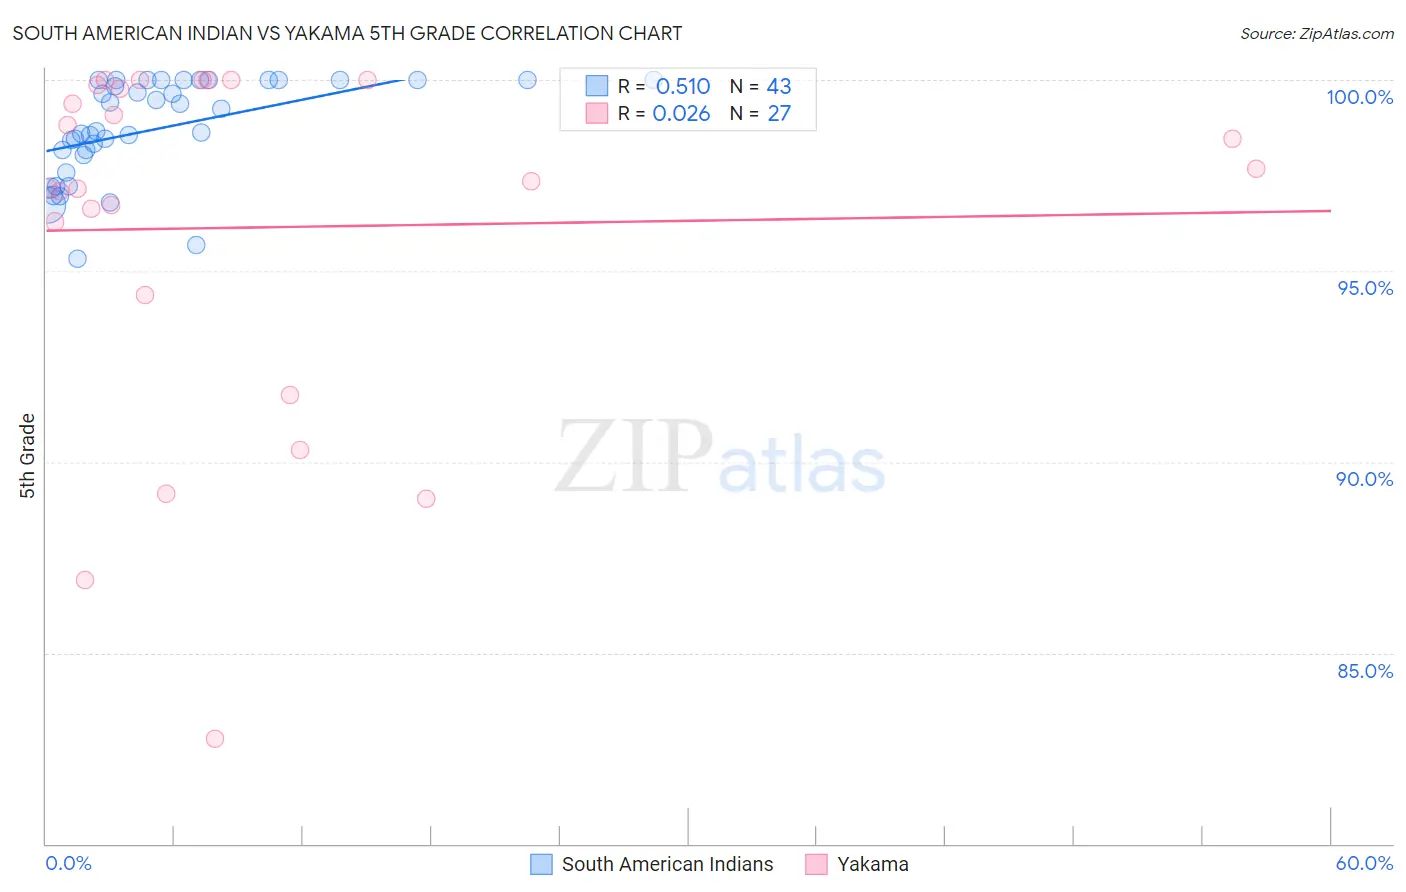
South American Indian vs Yakama 5th Grade Correlation Chart
The statistical analysis conducted on geographies consisting of 164,573,401 people shows a substantial positive correlation between the proportion of South American Indians and percentage of population with at least 5th grade education in the United States with a correlation coefficient (R) of 0.510 and weighted average of 97.0%. Similarly, the statistical analysis conducted on geographies consisting of 19,923,144 people shows no correlation between the proportion of Yakama and percentage of population with at least 5th grade education in the United States with a correlation coefficient (R) of 0.026 and weighted average of 94.8%, a difference of 2.4%.
5th Grade Correlation Summary
| Measurement | South American Indian | Yakama |
| Minimum | 95.3% | 82.8% |
| Maximum | 100.0% | 100.0% |
| Range | 4.7% | 17.2% |
| Mean | 98.7% | 96.1% |
| Median | 98.7% | 97.3% |
| Interquartile 25% (IQ1) | 98.0% | 94.4% |
| Interquartile 75% (IQ3) | 100.0% | 99.9% |
| Interquartile Range (IQR) | 2.0% | 5.5% |
| Standard Deviation (Sample) | 1.3% | 4.7% |
| Standard Deviation (Population) | 1.3% | 4.6% |
Similar Demographics by 5th Grade
Demographics Similar to South American Indians by 5th Grade
In terms of 5th grade, the demographic groups most similar to South American Indians are Liberian (97.0%, a difference of 0.0%), Bahamian (97.0%, a difference of 0.0%), Tongan (97.0%, a difference of 0.0%), Sierra Leonean (97.1%, a difference of 0.010%), and Immigrants from Panama (97.0%, a difference of 0.010%).
| Demographics | Rating | Rank | 5th Grade |
| Immigrants | Lebanon | 6.8 /100 | #217 | Tragic 97.1% |
| Immigrants | Sudan | 6.5 /100 | #218 | Tragic 97.1% |
| Immigrants | Syria | 6.4 /100 | #219 | Tragic 97.1% |
| Immigrants | Southern Europe | 6.3 /100 | #220 | Tragic 97.1% |
| Sierra Leoneans | 6.0 /100 | #221 | Tragic 97.1% |
| Immigrants | Panama | 5.7 /100 | #222 | Tragic 97.0% |
| Liberians | 5.7 /100 | #223 | Tragic 97.0% |
| South American Indians | 5.4 /100 | #224 | Tragic 97.0% |
| Bahamians | 5.3 /100 | #225 | Tragic 97.0% |
| Tongans | 5.3 /100 | #226 | Tragic 97.0% |
| Immigrants | Pakistan | 4.7 /100 | #227 | Tragic 97.0% |
| Assyrians/Chaldeans/Syriacs | 4.5 /100 | #228 | Tragic 97.0% |
| Yuman | 4.5 /100 | #229 | Tragic 97.0% |
| Immigrants | Western Asia | 4.3 /100 | #230 | Tragic 97.0% |
| Immigrants | Malaysia | 4.1 /100 | #231 | Tragic 97.0% |
Demographics Similar to Yakama by 5th Grade
In terms of 5th grade, the demographic groups most similar to Yakama are Guatemalan (94.8%, a difference of 0.080%), Immigrants from Yemen (94.9%, a difference of 0.10%), Immigrants from Central America (94.7%, a difference of 0.10%), Immigrants from Cabo Verde (94.9%, a difference of 0.15%), and Salvadoran (94.6%, a difference of 0.16%).
| Demographics | Rating | Rank | 5th Grade |
| Immigrants | Latin America | 0.0 /100 | #333 | Tragic 95.3% |
| Nepalese | 0.0 /100 | #334 | Tragic 95.2% |
| Mexicans | 0.0 /100 | #335 | Tragic 95.2% |
| Immigrants | Azores | 0.0 /100 | #336 | Tragic 95.1% |
| Central Americans | 0.0 /100 | #337 | Tragic 95.1% |
| Immigrants | Cabo Verde | 0.0 /100 | #338 | Tragic 94.9% |
| Immigrants | Yemen | 0.0 /100 | #339 | Tragic 94.9% |
| Guatemalans | 0.0 /100 | #340 | Tragic 94.8% |
| Yakama | 0.0 /100 | #341 | Tragic 94.8% |
| Immigrants | Central America | 0.0 /100 | #342 | Tragic 94.7% |
| Salvadorans | 0.0 /100 | #343 | Tragic 94.6% |
| Immigrants | Mexico | 0.0 /100 | #344 | Tragic 94.6% |
| Immigrants | Guatemala | 0.0 /100 | #345 | Tragic 94.6% |
| Immigrants | El Salvador | 0.0 /100 | #346 | Tragic 94.3% |
| Spanish American Indians | 0.0 /100 | #347 | Tragic 94.2% |