South American Indian vs Ghanaian 5th Grade
COMPARE
South American Indian
Ghanaian
5th Grade
5th Grade Comparison
South American Indians
Ghanaians
97.0%
5TH GRADE
5.4/ 100
METRIC RATING
224th/ 347
METRIC RANK
96.7%
5TH GRADE
0.2/ 100
METRIC RATING
269th/ 347
METRIC RANK
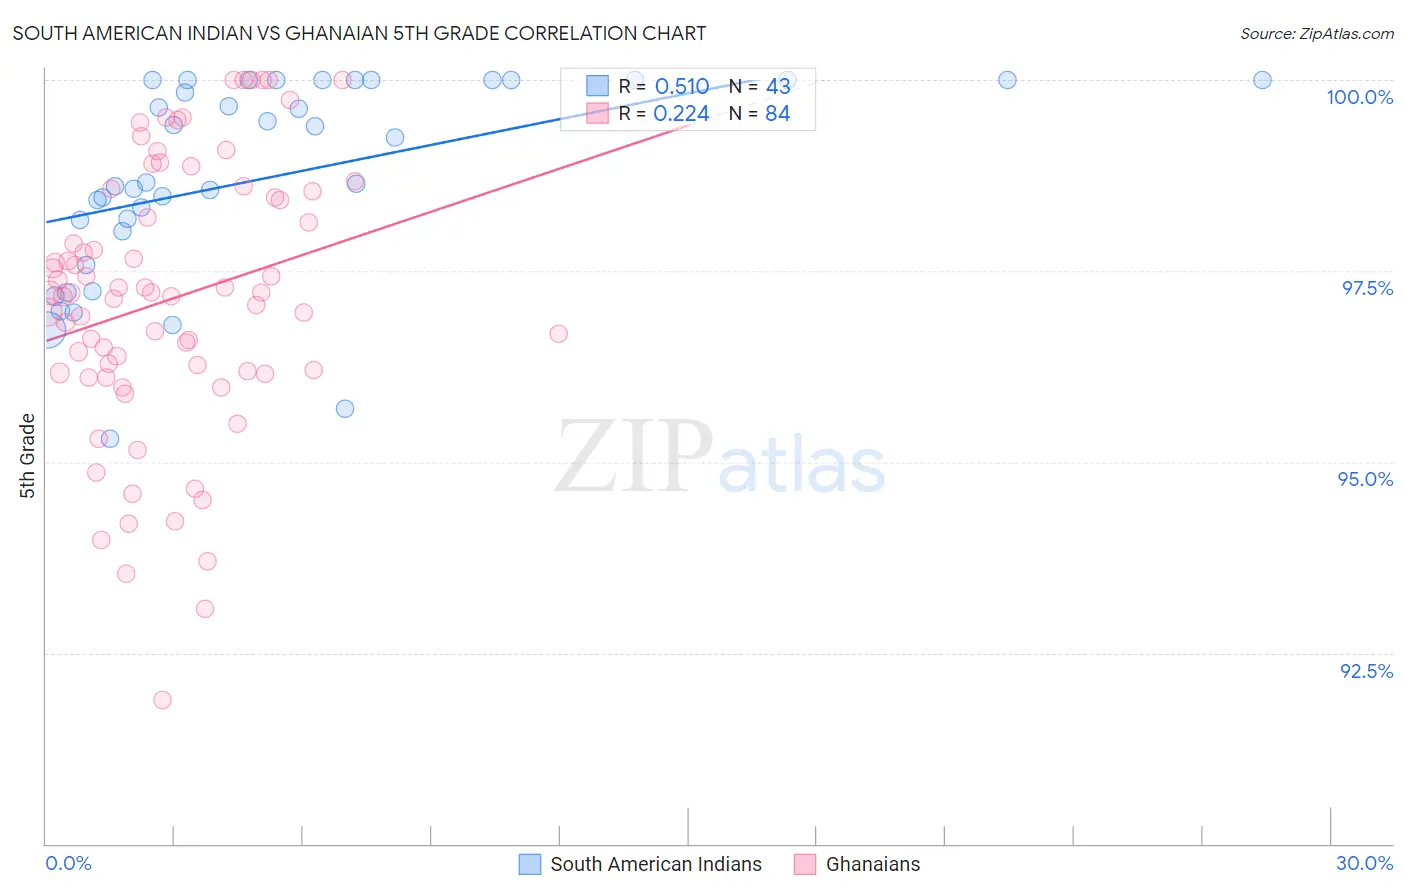
South American Indian vs Ghanaian 5th Grade Correlation Chart
The statistical analysis conducted on geographies consisting of 164,573,401 people shows a substantial positive correlation between the proportion of South American Indians and percentage of population with at least 5th grade education in the United States with a correlation coefficient (R) of 0.510 and weighted average of 97.0%. Similarly, the statistical analysis conducted on geographies consisting of 190,712,873 people shows a weak positive correlation between the proportion of Ghanaians and percentage of population with at least 5th grade education in the United States with a correlation coefficient (R) of 0.224 and weighted average of 96.7%, a difference of 0.33%.
5th Grade Correlation Summary
| Measurement | South American Indian | Ghanaian |
| Minimum | 95.3% | 91.9% |
| Maximum | 100.0% | 100.0% |
| Range | 4.7% | 8.1% |
| Mean | 98.7% | 97.1% |
| Median | 98.7% | 97.2% |
| Interquartile 25% (IQ1) | 98.0% | 96.2% |
| Interquartile 75% (IQ3) | 100.0% | 98.5% |
| Interquartile Range (IQR) | 2.0% | 2.3% |
| Standard Deviation (Sample) | 1.3% | 1.8% |
| Standard Deviation (Population) | 1.3% | 1.8% |
Similar Demographics by 5th Grade
Demographics Similar to South American Indians by 5th Grade
In terms of 5th grade, the demographic groups most similar to South American Indians are Liberian (97.0%, a difference of 0.0%), Bahamian (97.0%, a difference of 0.0%), Tongan (97.0%, a difference of 0.0%), Sierra Leonean (97.1%, a difference of 0.010%), and Immigrants from Panama (97.0%, a difference of 0.010%).
| Demographics | Rating | Rank | 5th Grade |
| Immigrants | Lebanon | 6.8 /100 | #217 | Tragic 97.1% |
| Immigrants | Sudan | 6.5 /100 | #218 | Tragic 97.1% |
| Immigrants | Syria | 6.4 /100 | #219 | Tragic 97.1% |
| Immigrants | Southern Europe | 6.3 /100 | #220 | Tragic 97.1% |
| Sierra Leoneans | 6.0 /100 | #221 | Tragic 97.1% |
| Immigrants | Panama | 5.7 /100 | #222 | Tragic 97.0% |
| Liberians | 5.7 /100 | #223 | Tragic 97.0% |
| South American Indians | 5.4 /100 | #224 | Tragic 97.0% |
| Bahamians | 5.3 /100 | #225 | Tragic 97.0% |
| Tongans | 5.3 /100 | #226 | Tragic 97.0% |
| Immigrants | Pakistan | 4.7 /100 | #227 | Tragic 97.0% |
| Assyrians/Chaldeans/Syriacs | 4.5 /100 | #228 | Tragic 97.0% |
| Yuman | 4.5 /100 | #229 | Tragic 97.0% |
| Immigrants | Western Asia | 4.3 /100 | #230 | Tragic 97.0% |
| Immigrants | Malaysia | 4.1 /100 | #231 | Tragic 97.0% |
Demographics Similar to Ghanaians by 5th Grade
In terms of 5th grade, the demographic groups most similar to Ghanaians are Armenian (96.7%, a difference of 0.010%), Immigrants from Nigeria (96.7%, a difference of 0.020%), Immigrants from South America (96.7%, a difference of 0.020%), West Indian (96.8%, a difference of 0.030%), and Taiwanese (96.7%, a difference of 0.030%).
| Demographics | Rating | Rank | 5th Grade |
| Immigrants | Colombia | 0.4 /100 | #262 | Tragic 96.8% |
| Immigrants | Uzbekistan | 0.3 /100 | #263 | Tragic 96.8% |
| West Indians | 0.3 /100 | #264 | Tragic 96.8% |
| Taiwanese | 0.3 /100 | #265 | Tragic 96.7% |
| Immigrants | Nigeria | 0.3 /100 | #266 | Tragic 96.7% |
| Immigrants | South America | 0.3 /100 | #267 | Tragic 96.7% |
| Armenians | 0.3 /100 | #268 | Tragic 96.7% |
| Ghanaians | 0.2 /100 | #269 | Tragic 96.7% |
| Afghans | 0.2 /100 | #270 | Tragic 96.7% |
| Immigrants | Hong Kong | 0.2 /100 | #271 | Tragic 96.7% |
| Trinidadians and Tobagonians | 0.1 /100 | #272 | Tragic 96.7% |
| Yaqui | 0.1 /100 | #273 | Tragic 96.7% |
| Immigrants | Cameroon | 0.1 /100 | #274 | Tragic 96.7% |
| Immigrants | Peru | 0.1 /100 | #275 | Tragic 96.6% |
| Cubans | 0.1 /100 | #276 | Tragic 96.6% |