Northern European vs Yakama 5th Grade
COMPARE
Northern European
Yakama
5th Grade
5th Grade Comparison
Northern Europeans
Yakama
98.0%
5TH GRADE
99.9/ 100
METRIC RATING
42nd/ 347
METRIC RANK
94.8%
5TH GRADE
0.0/ 100
METRIC RATING
341st/ 347
METRIC RANK
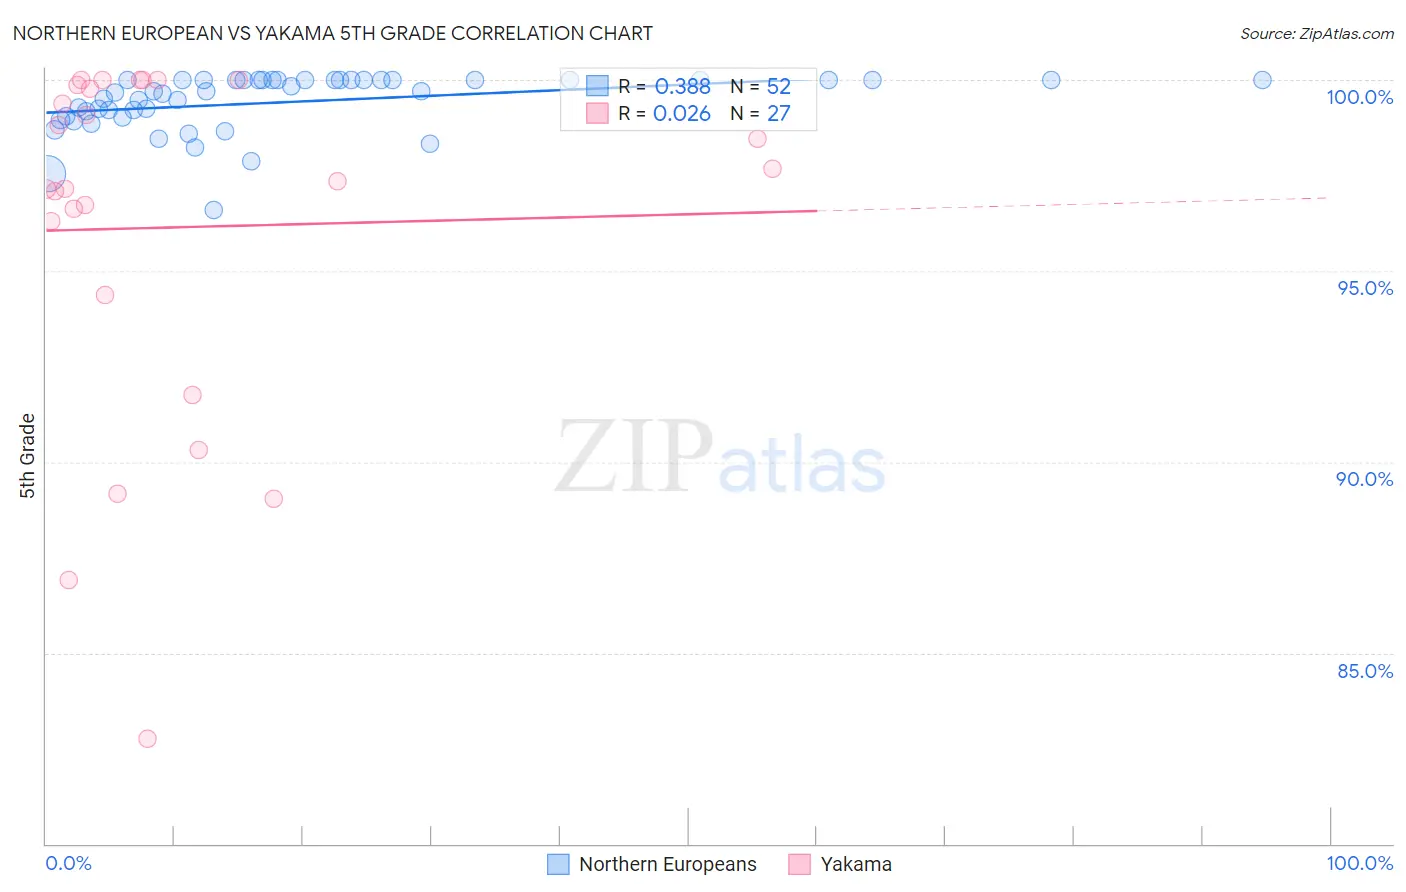
Northern European vs Yakama 5th Grade Correlation Chart
The statistical analysis conducted on geographies consisting of 406,093,361 people shows a mild positive correlation between the proportion of Northern Europeans and percentage of population with at least 5th grade education in the United States with a correlation coefficient (R) of 0.388 and weighted average of 98.0%. Similarly, the statistical analysis conducted on geographies consisting of 19,923,144 people shows no correlation between the proportion of Yakama and percentage of population with at least 5th grade education in the United States with a correlation coefficient (R) of 0.026 and weighted average of 94.8%, a difference of 3.5%.
5th Grade Correlation Summary
| Measurement | Northern European | Yakama |
| Minimum | 96.6% | 82.8% |
| Maximum | 100.0% | 100.0% |
| Range | 3.4% | 17.2% |
| Mean | 99.4% | 96.1% |
| Median | 99.7% | 97.3% |
| Interquartile 25% (IQ1) | 99.0% | 94.4% |
| Interquartile 75% (IQ3) | 100.0% | 99.9% |
| Interquartile Range (IQR) | 0.96% | 5.5% |
| Standard Deviation (Sample) | 0.75% | 4.7% |
| Standard Deviation (Population) | 0.74% | 4.6% |
Similar Demographics by 5th Grade
Demographics Similar to Northern Europeans by 5th Grade
In terms of 5th grade, the demographic groups most similar to Northern Europeans are Hungarian (98.0%, a difference of 0.010%), Ottawa (98.0%, a difference of 0.010%), Aleut (98.0%, a difference of 0.020%), Eastern European (98.1%, a difference of 0.030%), and Czechoslovakian (98.0%, a difference of 0.030%).
| Demographics | Rating | Rank | 5th Grade |
| Italians | 100.0 /100 | #35 | Exceptional 98.1% |
| British | 100.0 /100 | #36 | Exceptional 98.1% |
| Latvians | 99.9 /100 | #37 | Exceptional 98.1% |
| Belgians | 99.9 /100 | #38 | Exceptional 98.1% |
| Luxembourgers | 99.9 /100 | #39 | Exceptional 98.1% |
| Eastern Europeans | 99.9 /100 | #40 | Exceptional 98.1% |
| Hungarians | 99.9 /100 | #41 | Exceptional 98.0% |
| Northern Europeans | 99.9 /100 | #42 | Exceptional 98.0% |
| Ottawa | 99.9 /100 | #43 | Exceptional 98.0% |
| Aleuts | 99.9 /100 | #44 | Exceptional 98.0% |
| Czechoslovakians | 99.9 /100 | #45 | Exceptional 98.0% |
| Arapaho | 99.9 /100 | #46 | Exceptional 98.0% |
| Native Hawaiians | 99.9 /100 | #47 | Exceptional 98.0% |
| Bulgarians | 99.8 /100 | #48 | Exceptional 98.0% |
| Estonians | 99.8 /100 | #49 | Exceptional 98.0% |
Demographics Similar to Yakama by 5th Grade
In terms of 5th grade, the demographic groups most similar to Yakama are Guatemalan (94.8%, a difference of 0.080%), Immigrants from Yemen (94.9%, a difference of 0.10%), Immigrants from Central America (94.7%, a difference of 0.10%), Immigrants from Cabo Verde (94.9%, a difference of 0.15%), and Salvadoran (94.6%, a difference of 0.16%).
| Demographics | Rating | Rank | 5th Grade |
| Immigrants | Latin America | 0.0 /100 | #333 | Tragic 95.3% |
| Nepalese | 0.0 /100 | #334 | Tragic 95.2% |
| Mexicans | 0.0 /100 | #335 | Tragic 95.2% |
| Immigrants | Azores | 0.0 /100 | #336 | Tragic 95.1% |
| Central Americans | 0.0 /100 | #337 | Tragic 95.1% |
| Immigrants | Cabo Verde | 0.0 /100 | #338 | Tragic 94.9% |
| Immigrants | Yemen | 0.0 /100 | #339 | Tragic 94.9% |
| Guatemalans | 0.0 /100 | #340 | Tragic 94.8% |
| Yakama | 0.0 /100 | #341 | Tragic 94.8% |
| Immigrants | Central America | 0.0 /100 | #342 | Tragic 94.7% |
| Salvadorans | 0.0 /100 | #343 | Tragic 94.6% |
| Immigrants | Mexico | 0.0 /100 | #344 | Tragic 94.6% |
| Immigrants | Guatemala | 0.0 /100 | #345 | Tragic 94.6% |
| Immigrants | El Salvador | 0.0 /100 | #346 | Tragic 94.3% |
| Spanish American Indians | 0.0 /100 | #347 | Tragic 94.2% |