Immigrants from Korea vs Tlingit-Haida 3rd Grade
COMPARE
Immigrants from Korea
Tlingit-Haida
3rd Grade
3rd Grade Comparison
Immigrants from Korea
Tlingit-Haida
97.8%
3RD GRADE
50.9/ 100
METRIC RATING
173rd/ 347
METRIC RANK
98.5%
3RD GRADE
100.0/ 100
METRIC RATING
13th/ 347
METRIC RANK
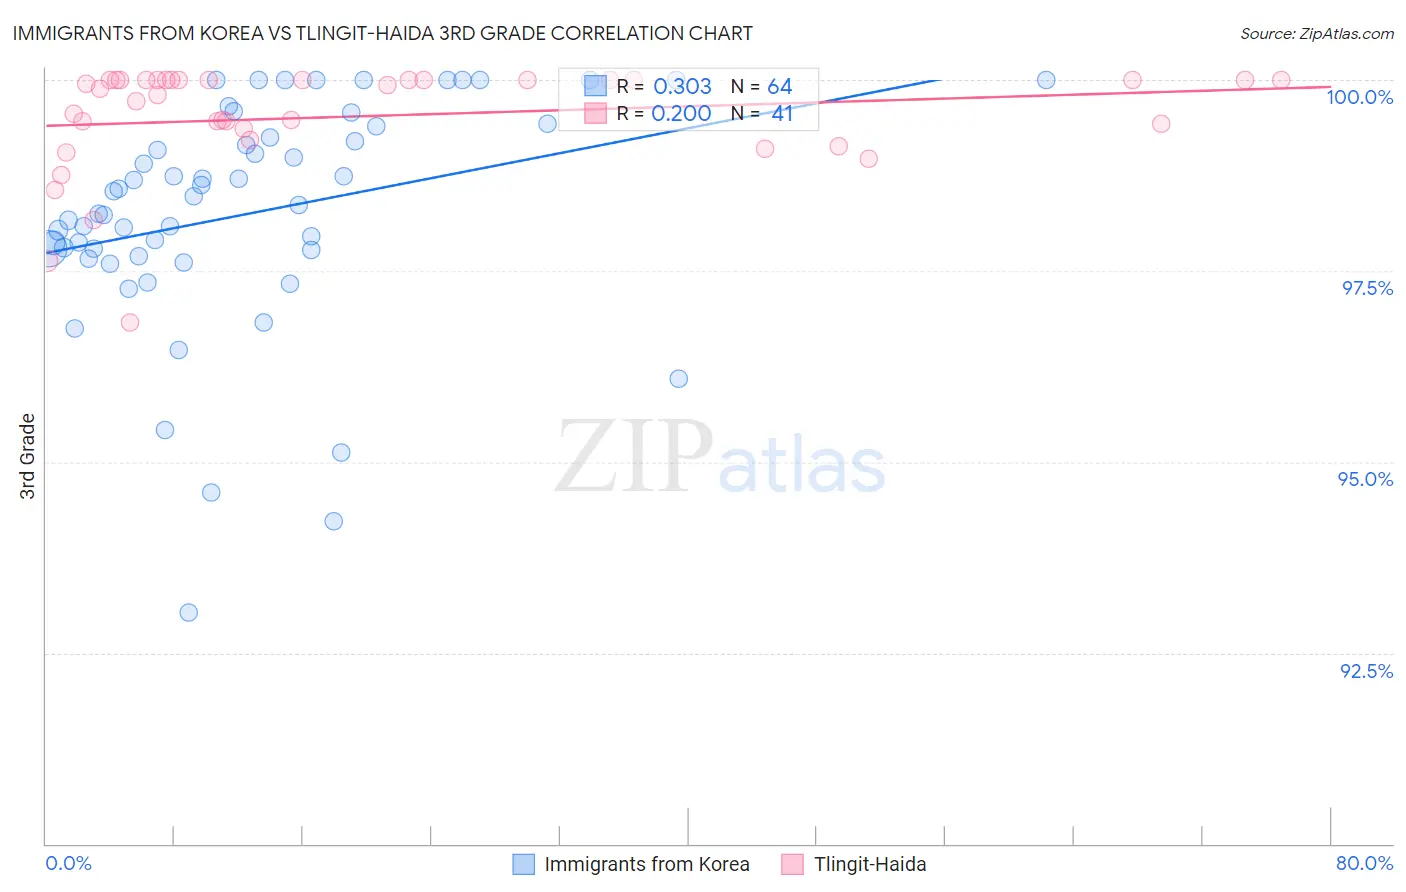
Immigrants from Korea vs Tlingit-Haida 3rd Grade Correlation Chart
The statistical analysis conducted on geographies consisting of 416,280,076 people shows a mild positive correlation between the proportion of Immigrants from Korea and percentage of population with at least 3rd grade education in the United States with a correlation coefficient (R) of 0.303 and weighted average of 97.8%. Similarly, the statistical analysis conducted on geographies consisting of 60,865,648 people shows a poor positive correlation between the proportion of Tlingit-Haida and percentage of population with at least 3rd grade education in the United States with a correlation coefficient (R) of 0.200 and weighted average of 98.5%, a difference of 0.80%.
3rd Grade Correlation Summary
| Measurement | Immigrants from Korea | Tlingit-Haida |
| Minimum | 93.0% | 96.8% |
| Maximum | 100.0% | 100.0% |
| Range | 7.0% | 3.2% |
| Mean | 98.3% | 99.5% |
| Median | 98.4% | 99.9% |
| Interquartile 25% (IQ1) | 97.7% | 99.3% |
| Interquartile 75% (IQ3) | 99.3% | 100.0% |
| Interquartile Range (IQR) | 1.6% | 0.71% |
| Standard Deviation (Sample) | 1.5% | 0.71% |
| Standard Deviation (Population) | 1.5% | 0.70% |
Similar Demographics by 3rd Grade
Demographics Similar to Immigrants from Korea by 3rd Grade
In terms of 3rd grade, the demographic groups most similar to Immigrants from Korea are Kenyan (97.8%, a difference of 0.0%), Spanish American (97.8%, a difference of 0.0%), Navajo (97.8%, a difference of 0.0%), Chilean (97.8%, a difference of 0.010%), and Immigrants from Spain (97.8%, a difference of 0.010%).
| Demographics | Rating | Rank | 3rd Grade |
| Dutch West Indians | 55.5 /100 | #166 | Average 97.8% |
| Chileans | 55.3 /100 | #167 | Average 97.8% |
| Immigrants | Spain | 54.3 /100 | #168 | Average 97.8% |
| Comanche | 53.8 /100 | #169 | Average 97.8% |
| Brazilians | 53.7 /100 | #170 | Average 97.8% |
| Kenyans | 51.8 /100 | #171 | Average 97.8% |
| Spanish Americans | 51.8 /100 | #172 | Average 97.8% |
| Immigrants | Korea | 50.9 /100 | #173 | Average 97.8% |
| Navajo | 50.0 /100 | #174 | Average 97.8% |
| Immigrants | Micronesia | 47.6 /100 | #175 | Average 97.8% |
| Immigrants | Poland | 47.1 /100 | #176 | Average 97.8% |
| Egyptians | 46.6 /100 | #177 | Average 97.7% |
| Immigrants | Brazil | 46.4 /100 | #178 | Average 97.7% |
| Immigrants | Belarus | 45.9 /100 | #179 | Average 97.7% |
| Immigrants | Sri Lanka | 45.1 /100 | #180 | Average 97.7% |
Demographics Similar to Tlingit-Haida by 3rd Grade
In terms of 3rd grade, the demographic groups most similar to Tlingit-Haida are English (98.6%, a difference of 0.0%), Carpatho Rusyn (98.5%, a difference of 0.0%), Swedish (98.5%, a difference of 0.010%), Alaska Native (98.6%, a difference of 0.020%), and Slovene (98.6%, a difference of 0.020%).
| Demographics | Rating | Rank | 3rd Grade |
| Alaskan Athabascans | 100.0 /100 | #6 | Exceptional 98.7% |
| Norwegians | 100.0 /100 | #7 | Exceptional 98.6% |
| Slovaks | 100.0 /100 | #8 | Exceptional 98.6% |
| Germans | 100.0 /100 | #9 | Exceptional 98.6% |
| Alaska Natives | 100.0 /100 | #10 | Exceptional 98.6% |
| Slovenes | 100.0 /100 | #11 | Exceptional 98.6% |
| English | 100.0 /100 | #12 | Exceptional 98.6% |
| Tlingit-Haida | 100.0 /100 | #13 | Exceptional 98.5% |
| Carpatho Rusyns | 100.0 /100 | #14 | Exceptional 98.5% |
| Swedes | 100.0 /100 | #15 | Exceptional 98.5% |
| Scottish | 100.0 /100 | #16 | Exceptional 98.5% |
| Dutch | 100.0 /100 | #17 | Exceptional 98.5% |
| Irish | 100.0 /100 | #18 | Exceptional 98.5% |
| Poles | 100.0 /100 | #19 | Exceptional 98.5% |
| Pennsylvania Germans | 100.0 /100 | #20 | Exceptional 98.5% |