South American Indian vs Immigrants from Mexico Associate's Degree
COMPARE
South American Indian
Immigrants from Mexico
Associate's Degree
Associate's Degree Comparison
South American Indians
Immigrants from Mexico
47.4%
ASSOCIATE'S DEGREE
76.7/ 100
METRIC RATING
148th/ 347
METRIC RANK
33.7%
ASSOCIATE'S DEGREE
0.0/ 100
METRIC RATING
339th/ 347
METRIC RANK
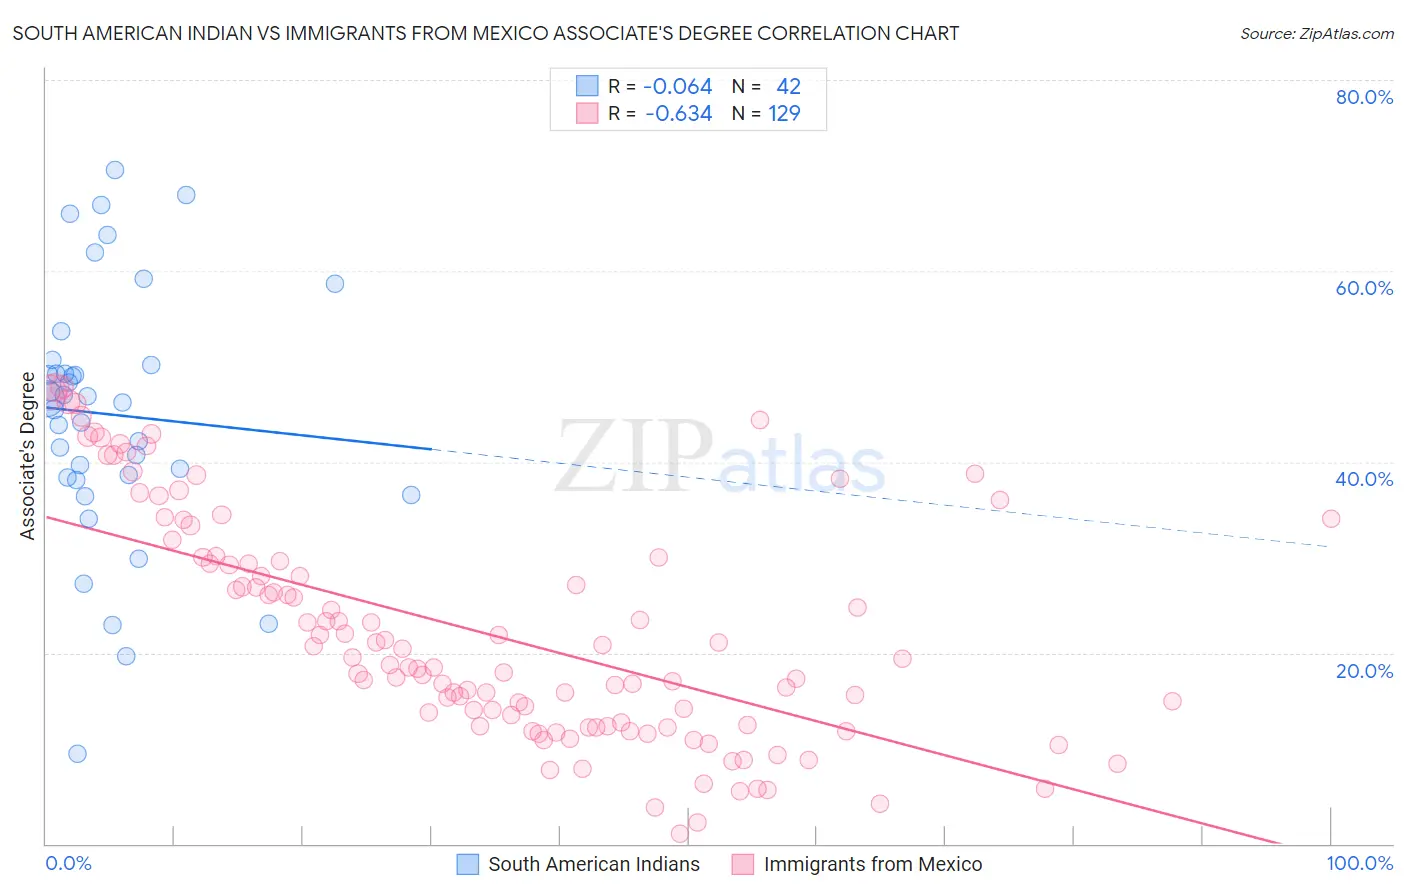
South American Indian vs Immigrants from Mexico Associate's Degree Correlation Chart
The statistical analysis conducted on geographies consisting of 164,573,088 people shows a slight negative correlation between the proportion of South American Indians and percentage of population with at least associate's degree education in the United States with a correlation coefficient (R) of -0.064 and weighted average of 47.4%. Similarly, the statistical analysis conducted on geographies consisting of 513,696,762 people shows a significant negative correlation between the proportion of Immigrants from Mexico and percentage of population with at least associate's degree education in the United States with a correlation coefficient (R) of -0.634 and weighted average of 33.7%, a difference of 40.5%.
Associate's Degree Correlation Summary
| Measurement | South American Indian | Immigrants from Mexico |
| Minimum | 9.4% | 0.99% |
| Maximum | 70.6% | 47.9% |
| Range | 61.2% | 46.9% |
| Mean | 45.0% | 22.3% |
| Median | 46.5% | 19.4% |
| Interquartile 25% (IQ1) | 38.4% | 12.4% |
| Interquartile 75% (IQ3) | 50.2% | 30.0% |
| Interquartile Range (IQR) | 11.8% | 17.6% |
| Standard Deviation (Sample) | 13.3% | 12.0% |
| Standard Deviation (Population) | 13.2% | 11.9% |
Similar Demographics by Associate's Degree
Demographics Similar to South American Indians by Associate's Degree
In terms of associate's degree, the demographic groups most similar to South American Indians are Immigrants from Armenia (47.4%, a difference of 0.010%), Iraqi (47.4%, a difference of 0.050%), Danish (47.4%, a difference of 0.060%), Immigrants from North Macedonia (47.4%, a difference of 0.070%), and Immigrants from Sudan (47.4%, a difference of 0.12%).
| Demographics | Rating | Rank | Associate's Degree |
| Taiwanese | 83.3 /100 | #141 | Excellent 47.7% |
| Sierra Leoneans | 82.9 /100 | #142 | Excellent 47.7% |
| Norwegians | 81.0 /100 | #143 | Excellent 47.6% |
| Slavs | 80.5 /100 | #144 | Excellent 47.6% |
| Canadians | 79.0 /100 | #145 | Good 47.5% |
| Immigrants | Sudan | 77.9 /100 | #146 | Good 47.4% |
| Danes | 77.3 /100 | #147 | Good 47.4% |
| South American Indians | 76.7 /100 | #148 | Good 47.4% |
| Immigrants | Armenia | 76.6 /100 | #149 | Good 47.4% |
| Iraqis | 76.2 /100 | #150 | Good 47.4% |
| Immigrants | North Macedonia | 76.0 /100 | #151 | Good 47.4% |
| Immigrants | Afghanistan | 74.3 /100 | #152 | Good 47.3% |
| Czechs | 72.2 /100 | #153 | Good 47.2% |
| Immigrants | Kenya | 72.1 /100 | #154 | Good 47.2% |
| Kenyans | 70.6 /100 | #155 | Good 47.1% |
Demographics Similar to Immigrants from Mexico by Associate's Degree
In terms of associate's degree, the demographic groups most similar to Immigrants from Mexico are Pueblo (34.0%, a difference of 0.71%), Lumbee (34.1%, a difference of 1.1%), Hopi (34.6%, a difference of 2.4%), Spanish American Indian (34.9%, a difference of 3.3%), and Native/Alaskan (34.9%, a difference of 3.5%).
| Demographics | Rating | Rank | Associate's Degree |
| Immigrants | Central America | 0.0 /100 | #332 | Tragic 35.0% |
| Mexicans | 0.0 /100 | #333 | Tragic 35.0% |
| Natives/Alaskans | 0.0 /100 | #334 | Tragic 34.9% |
| Spanish American Indians | 0.0 /100 | #335 | Tragic 34.9% |
| Hopi | 0.0 /100 | #336 | Tragic 34.6% |
| Lumbee | 0.0 /100 | #337 | Tragic 34.1% |
| Pueblo | 0.0 /100 | #338 | Tragic 34.0% |
| Immigrants | Mexico | 0.0 /100 | #339 | Tragic 33.7% |
| Navajo | 0.0 /100 | #340 | Tragic 32.6% |
| Inupiat | 0.0 /100 | #341 | Tragic 32.6% |
| Yakama | 0.0 /100 | #342 | Tragic 32.3% |
| Tohono O'odham | 0.0 /100 | #343 | Tragic 31.8% |
| Yuman | 0.0 /100 | #344 | Tragic 31.3% |
| Pima | 0.0 /100 | #345 | Tragic 30.2% |
| Houma | 0.0 /100 | #346 | Tragic 28.2% |