Immigrants from Nicaragua vs Immigrants from Syria High School Diploma
COMPARE
Immigrants from Nicaragua
Immigrants from Syria
High School Diploma
High School Diploma Comparison
Immigrants from Nicaragua
Immigrants from Syria
83.1%
HIGH SCHOOL DIPLOMA
0.0/ 100
METRIC RATING
325th/ 347
METRIC RANK
89.0%
HIGH SCHOOL DIPLOMA
39.2/ 100
METRIC RATING
184th/ 347
METRIC RANK
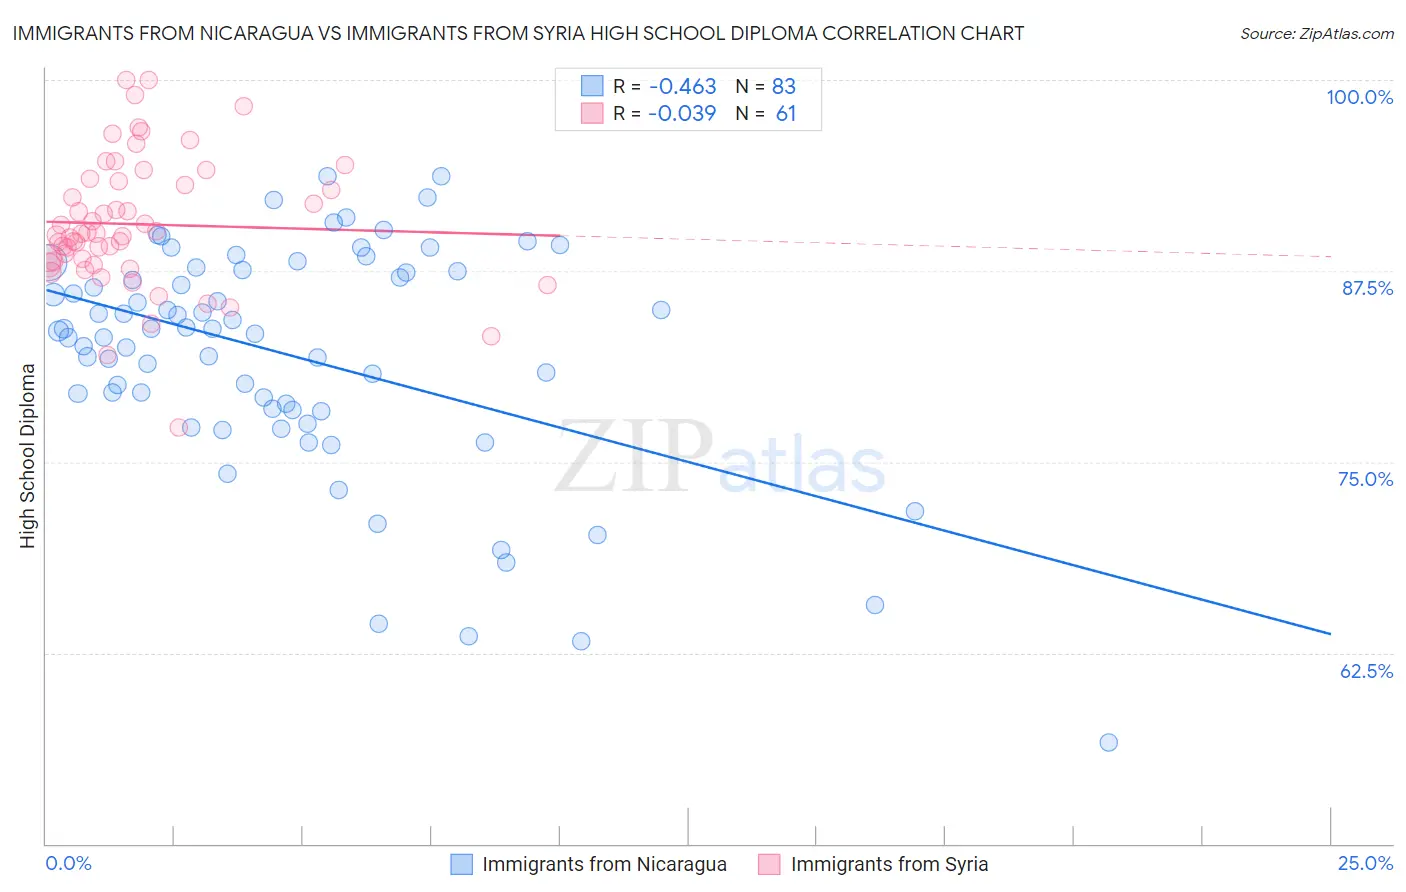
Immigrants from Nicaragua vs Immigrants from Syria High School Diploma Correlation Chart
The statistical analysis conducted on geographies consisting of 236,340,156 people shows a moderate negative correlation between the proportion of Immigrants from Nicaragua and percentage of population with at least high school diploma education in the United States with a correlation coefficient (R) of -0.463 and weighted average of 83.1%. Similarly, the statistical analysis conducted on geographies consisting of 174,108,882 people shows no correlation between the proportion of Immigrants from Syria and percentage of population with at least high school diploma education in the United States with a correlation coefficient (R) of -0.039 and weighted average of 89.0%, a difference of 7.1%.
High School Diploma Correlation Summary
| Measurement | Immigrants from Nicaragua | Immigrants from Syria |
| Minimum | 56.7% | 77.2% |
| Maximum | 93.7% | 100.0% |
| Range | 37.0% | 22.8% |
| Mean | 81.9% | 90.6% |
| Median | 83.6% | 90.0% |
| Interquartile 25% (IQ1) | 78.4% | 88.0% |
| Interquartile 75% (IQ3) | 87.5% | 93.5% |
| Interquartile Range (IQR) | 9.1% | 5.4% |
| Standard Deviation (Sample) | 7.5% | 4.4% |
| Standard Deviation (Population) | 7.5% | 4.3% |
Similar Demographics by High School Diploma
Demographics Similar to Immigrants from Nicaragua by High School Diploma
In terms of high school diploma, the demographic groups most similar to Immigrants from Nicaragua are Mexican American Indian (83.0%, a difference of 0.070%), Honduran (83.0%, a difference of 0.11%), Dominican (82.9%, a difference of 0.16%), Immigrants from Cabo Verde (83.3%, a difference of 0.23%), and Hispanic or Latino (82.9%, a difference of 0.26%).
| Demographics | Rating | Rank | High School Diploma |
| Immigrants | Belize | 0.0 /100 | #318 | Tragic 84.2% |
| Central American Indians | 0.0 /100 | #319 | Tragic 84.2% |
| Nicaraguans | 0.0 /100 | #320 | Tragic 84.1% |
| Yuman | 0.0 /100 | #321 | Tragic 84.0% |
| Lumbee | 0.0 /100 | #322 | Tragic 83.6% |
| Immigrants | Cuba | 0.0 /100 | #323 | Tragic 83.5% |
| Immigrants | Cabo Verde | 0.0 /100 | #324 | Tragic 83.3% |
| Immigrants | Nicaragua | 0.0 /100 | #325 | Tragic 83.1% |
| Mexican American Indians | 0.0 /100 | #326 | Tragic 83.0% |
| Hondurans | 0.0 /100 | #327 | Tragic 83.0% |
| Dominicans | 0.0 /100 | #328 | Tragic 82.9% |
| Hispanics or Latinos | 0.0 /100 | #329 | Tragic 82.9% |
| Immigrants | Azores | 0.0 /100 | #330 | Tragic 82.8% |
| Central Americans | 0.0 /100 | #331 | Tragic 82.5% |
| Immigrants | Honduras | 0.0 /100 | #332 | Tragic 82.5% |
Demographics Similar to Immigrants from Syria by High School Diploma
In terms of high school diploma, the demographic groups most similar to Immigrants from Syria are Ethiopian (89.0%, a difference of 0.040%), Potawatomi (89.0%, a difference of 0.050%), Spaniard (89.1%, a difference of 0.060%), Immigrants from Eastern Africa (88.9%, a difference of 0.060%), and Guamanian/Chamorro (88.9%, a difference of 0.060%).
| Demographics | Rating | Rank | High School Diploma |
| Sudanese | 48.5 /100 | #177 | Average 89.1% |
| Sierra Leoneans | 48.4 /100 | #178 | Average 89.1% |
| Americans | 47.2 /100 | #179 | Average 89.1% |
| Bolivians | 45.2 /100 | #180 | Average 89.1% |
| Venezuelans | 43.6 /100 | #181 | Average 89.1% |
| Spaniards | 43.4 /100 | #182 | Average 89.1% |
| Potawatomi | 42.5 /100 | #183 | Average 89.0% |
| Immigrants | Syria | 39.2 /100 | #184 | Fair 89.0% |
| Ethiopians | 37.0 /100 | #185 | Fair 89.0% |
| Immigrants | Eastern Africa | 35.8 /100 | #186 | Fair 88.9% |
| Guamanians/Chamorros | 35.5 /100 | #187 | Fair 88.9% |
| Immigrants | Sudan | 33.4 /100 | #188 | Fair 88.9% |
| Immigrants | Uganda | 32.6 /100 | #189 | Fair 88.9% |
| Immigrants | Chile | 31.9 /100 | #190 | Fair 88.9% |
| Immigrants | Ethiopia | 30.9 /100 | #191 | Fair 88.9% |