Somali vs Immigrants from Asia 3rd Grade
COMPARE
Somali
Immigrants from Asia
3rd Grade
3rd Grade Comparison
Somalis
Immigrants from Asia
96.8%
3RD GRADE
0.0/ 100
METRIC RATING
299th/ 347
METRIC RANK
97.4%
3RD GRADE
0.8/ 100
METRIC RATING
251st/ 347
METRIC RANK
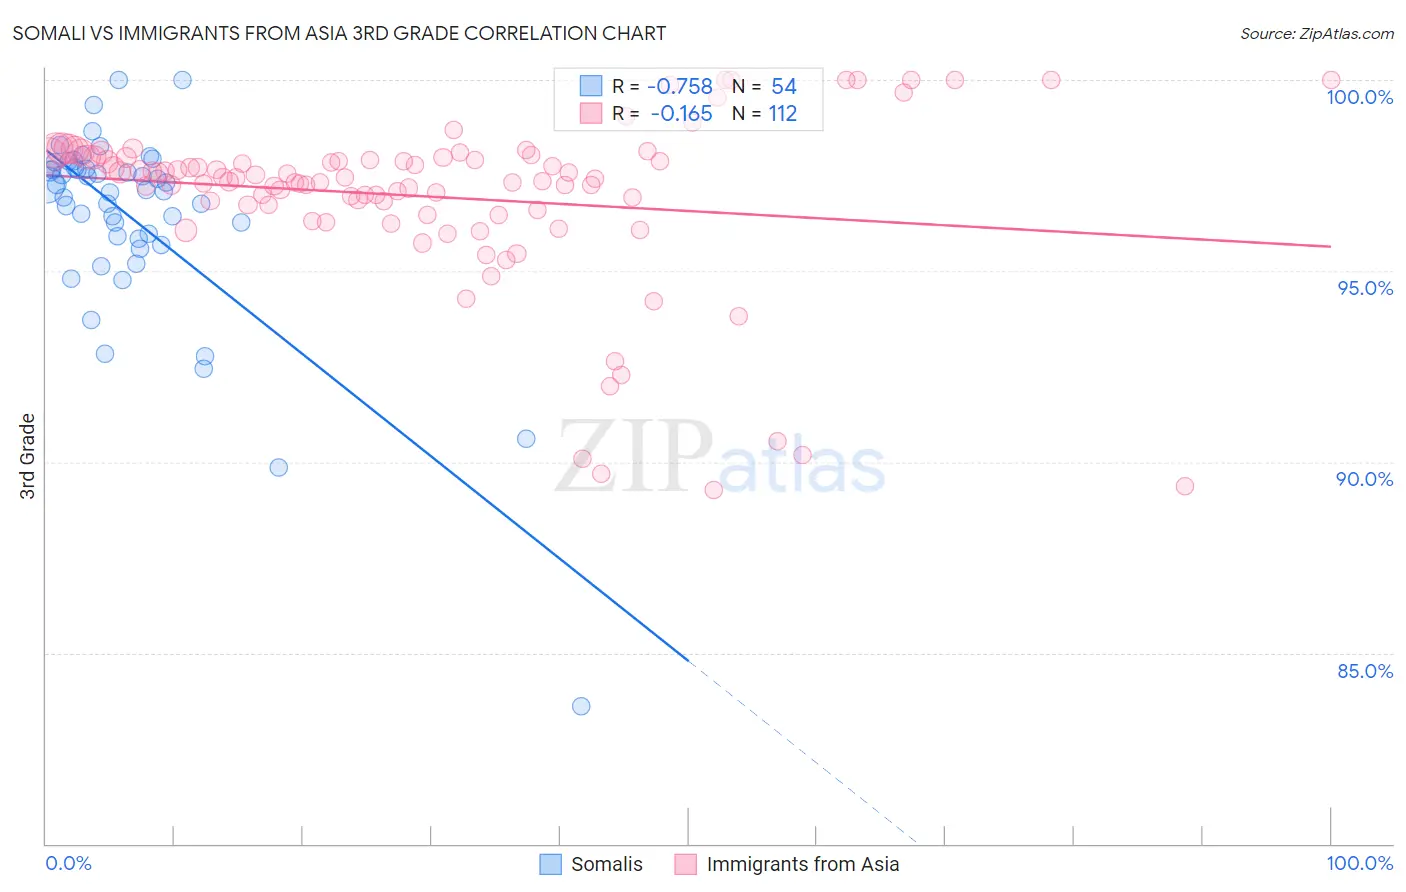
Somali vs Immigrants from Asia 3rd Grade Correlation Chart
The statistical analysis conducted on geographies consisting of 99,332,457 people shows a strong negative correlation between the proportion of Somalis and percentage of population with at least 3rd grade education in the United States with a correlation coefficient (R) of -0.758 and weighted average of 96.8%. Similarly, the statistical analysis conducted on geographies consisting of 549,170,269 people shows a poor negative correlation between the proportion of Immigrants from Asia and percentage of population with at least 3rd grade education in the United States with a correlation coefficient (R) of -0.165 and weighted average of 97.4%, a difference of 0.54%.
3rd Grade Correlation Summary
| Measurement | Somali | Immigrants from Asia |
| Minimum | 83.6% | 89.3% |
| Maximum | 100.0% | 100.0% |
| Range | 16.4% | 10.7% |
| Mean | 96.3% | 96.9% |
| Median | 97.1% | 97.4% |
| Interquartile 25% (IQ1) | 95.8% | 96.7% |
| Interquartile 75% (IQ3) | 97.7% | 98.0% |
| Interquartile Range (IQR) | 1.8% | 1.3% |
| Standard Deviation (Sample) | 2.7% | 2.2% |
| Standard Deviation (Population) | 2.7% | 2.2% |
Similar Demographics by 3rd Grade
Demographics Similar to Somalis by 3rd Grade
In terms of 3rd grade, the demographic groups most similar to Somalis are Immigrants from Dominica (96.9%, a difference of 0.010%), Immigrants from South Eastern Asia (96.8%, a difference of 0.010%), Haitian (96.9%, a difference of 0.020%), Immigrants from Cuba (96.8%, a difference of 0.020%), and Immigrants (96.9%, a difference of 0.040%).
| Demographics | Rating | Rank | 3rd Grade |
| British West Indians | 0.0 /100 | #292 | Tragic 97.0% |
| Immigrants | Grenada | 0.0 /100 | #293 | Tragic 97.0% |
| Malaysians | 0.0 /100 | #294 | Tragic 97.0% |
| Immigrants | Eritrea | 0.0 /100 | #295 | Tragic 97.0% |
| Immigrants | Immigrants | 0.0 /100 | #296 | Tragic 96.9% |
| Haitians | 0.0 /100 | #297 | Tragic 96.9% |
| Immigrants | Dominica | 0.0 /100 | #298 | Tragic 96.9% |
| Somalis | 0.0 /100 | #299 | Tragic 96.8% |
| Immigrants | South Eastern Asia | 0.0 /100 | #300 | Tragic 96.8% |
| Immigrants | Cuba | 0.0 /100 | #301 | Tragic 96.8% |
| Immigrants | Somalia | 0.0 /100 | #302 | Tragic 96.8% |
| Ecuadorians | 0.0 /100 | #303 | Tragic 96.7% |
| Immigrants | Caribbean | 0.0 /100 | #304 | Tragic 96.7% |
| Central American Indians | 0.0 /100 | #305 | Tragic 96.7% |
| Guyanese | 0.0 /100 | #306 | Tragic 96.7% |
Demographics Similar to Immigrants from Asia by 3rd Grade
In terms of 3rd grade, the demographic groups most similar to Immigrants from Asia are Immigrants from Middle Africa (97.4%, a difference of 0.0%), Peruvian (97.4%, a difference of 0.0%), Immigrants from Africa (97.4%, a difference of 0.0%), Immigrants from Senegal (97.4%, a difference of 0.010%), and Assyrian/Chaldean/Syriac (97.4%, a difference of 0.010%).
| Demographics | Rating | Rank | 3rd Grade |
| Asians | 1.1 /100 | #244 | Tragic 97.4% |
| Ethiopians | 1.1 /100 | #245 | Tragic 97.4% |
| Immigrants | Senegal | 1.0 /100 | #246 | Tragic 97.4% |
| Assyrians/Chaldeans/Syriacs | 1.0 /100 | #247 | Tragic 97.4% |
| Immigrants | Eastern Africa | 0.9 /100 | #248 | Tragic 97.4% |
| South Americans | 0.9 /100 | #249 | Tragic 97.4% |
| Immigrants | Middle Africa | 0.9 /100 | #250 | Tragic 97.4% |
| Immigrants | Asia | 0.8 /100 | #251 | Tragic 97.4% |
| Peruvians | 0.8 /100 | #252 | Tragic 97.4% |
| Immigrants | Africa | 0.8 /100 | #253 | Tragic 97.4% |
| Jamaicans | 0.7 /100 | #254 | Tragic 97.4% |
| Bolivians | 0.6 /100 | #255 | Tragic 97.3% |
| Immigrants | Congo | 0.6 /100 | #256 | Tragic 97.3% |
| Immigrants | Colombia | 0.5 /100 | #257 | Tragic 97.3% |
| Immigrants | Liberia | 0.5 /100 | #258 | Tragic 97.3% |