Somali vs Immigrants from Ethiopia 3rd Grade
COMPARE
Somali
Immigrants from Ethiopia
3rd Grade
3rd Grade Comparison
Somalis
Immigrants from Ethiopia
96.8%
3RD GRADE
0.0/ 100
METRIC RATING
299th/ 347
METRIC RANK
97.3%
3RD GRADE
0.4/ 100
METRIC RATING
260th/ 347
METRIC RANK
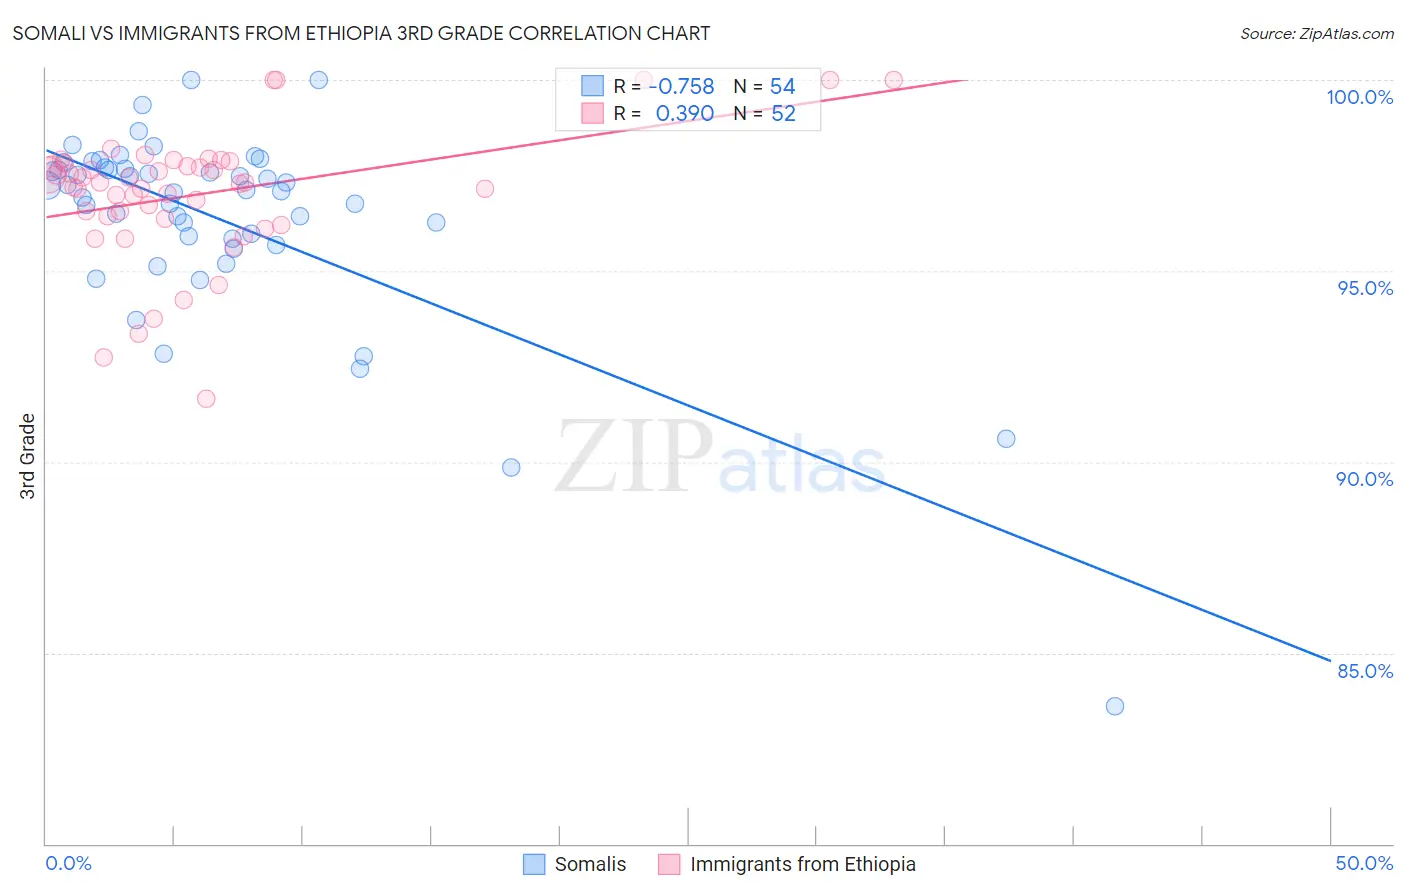
Somali vs Immigrants from Ethiopia 3rd Grade Correlation Chart
The statistical analysis conducted on geographies consisting of 99,332,457 people shows a strong negative correlation between the proportion of Somalis and percentage of population with at least 3rd grade education in the United States with a correlation coefficient (R) of -0.758 and weighted average of 96.8%. Similarly, the statistical analysis conducted on geographies consisting of 211,514,076 people shows a mild positive correlation between the proportion of Immigrants from Ethiopia and percentage of population with at least 3rd grade education in the United States with a correlation coefficient (R) of 0.390 and weighted average of 97.3%, a difference of 0.48%.
3rd Grade Correlation Summary
| Measurement | Somali | Immigrants from Ethiopia |
| Minimum | 83.6% | 91.7% |
| Maximum | 100.0% | 100.0% |
| Range | 16.4% | 8.3% |
| Mean | 96.3% | 97.0% |
| Median | 97.1% | 97.3% |
| Interquartile 25% (IQ1) | 95.8% | 96.4% |
| Interquartile 75% (IQ3) | 97.7% | 97.8% |
| Interquartile Range (IQR) | 1.8% | 1.4% |
| Standard Deviation (Sample) | 2.7% | 1.7% |
| Standard Deviation (Population) | 2.7% | 1.7% |
Similar Demographics by 3rd Grade
Demographics Similar to Somalis by 3rd Grade
In terms of 3rd grade, the demographic groups most similar to Somalis are Immigrants from Dominica (96.9%, a difference of 0.010%), Immigrants from South Eastern Asia (96.8%, a difference of 0.010%), Haitian (96.9%, a difference of 0.020%), Immigrants from Cuba (96.8%, a difference of 0.020%), and Immigrants (96.9%, a difference of 0.040%).
| Demographics | Rating | Rank | 3rd Grade |
| British West Indians | 0.0 /100 | #292 | Tragic 97.0% |
| Immigrants | Grenada | 0.0 /100 | #293 | Tragic 97.0% |
| Malaysians | 0.0 /100 | #294 | Tragic 97.0% |
| Immigrants | Eritrea | 0.0 /100 | #295 | Tragic 97.0% |
| Immigrants | Immigrants | 0.0 /100 | #296 | Tragic 96.9% |
| Haitians | 0.0 /100 | #297 | Tragic 96.9% |
| Immigrants | Dominica | 0.0 /100 | #298 | Tragic 96.9% |
| Somalis | 0.0 /100 | #299 | Tragic 96.8% |
| Immigrants | South Eastern Asia | 0.0 /100 | #300 | Tragic 96.8% |
| Immigrants | Cuba | 0.0 /100 | #301 | Tragic 96.8% |
| Immigrants | Somalia | 0.0 /100 | #302 | Tragic 96.8% |
| Ecuadorians | 0.0 /100 | #303 | Tragic 96.7% |
| Immigrants | Caribbean | 0.0 /100 | #304 | Tragic 96.7% |
| Central American Indians | 0.0 /100 | #305 | Tragic 96.7% |
| Guyanese | 0.0 /100 | #306 | Tragic 96.7% |
Demographics Similar to Immigrants from Ethiopia by 3rd Grade
In terms of 3rd grade, the demographic groups most similar to Immigrants from Ethiopia are Immigrants from South America (97.3%, a difference of 0.0%), Immigrants from Liberia (97.3%, a difference of 0.010%), Armenian (97.3%, a difference of 0.010%), Immigrants from Sierra Leone (97.3%, a difference of 0.010%), and Immigrants from Colombia (97.3%, a difference of 0.020%).
| Demographics | Rating | Rank | 3rd Grade |
| Immigrants | Africa | 0.8 /100 | #253 | Tragic 97.4% |
| Jamaicans | 0.7 /100 | #254 | Tragic 97.4% |
| Bolivians | 0.6 /100 | #255 | Tragic 97.3% |
| Immigrants | Congo | 0.6 /100 | #256 | Tragic 97.3% |
| Immigrants | Colombia | 0.5 /100 | #257 | Tragic 97.3% |
| Immigrants | Liberia | 0.5 /100 | #258 | Tragic 97.3% |
| Armenians | 0.4 /100 | #259 | Tragic 97.3% |
| Immigrants | Ethiopia | 0.4 /100 | #260 | Tragic 97.3% |
| Immigrants | South America | 0.4 /100 | #261 | Tragic 97.3% |
| Immigrants | Sierra Leone | 0.4 /100 | #262 | Tragic 97.3% |
| Taiwanese | 0.3 /100 | #263 | Tragic 97.3% |
| West Indians | 0.3 /100 | #264 | Tragic 97.3% |
| Immigrants | Jamaica | 0.3 /100 | #265 | Tragic 97.3% |
| Yaqui | 0.3 /100 | #266 | Tragic 97.3% |
| Immigrants | Nigeria | 0.3 /100 | #267 | Tragic 97.3% |