Somali vs Immigrants from Argentina 3rd Grade
COMPARE
Somali
Immigrants from Argentina
3rd Grade
3rd Grade Comparison
Somalis
Immigrants from Argentina
96.8%
3RD GRADE
0.0/ 100
METRIC RATING
299th/ 347
METRIC RANK
97.7%
3RD GRADE
37.0/ 100
METRIC RATING
185th/ 347
METRIC RANK
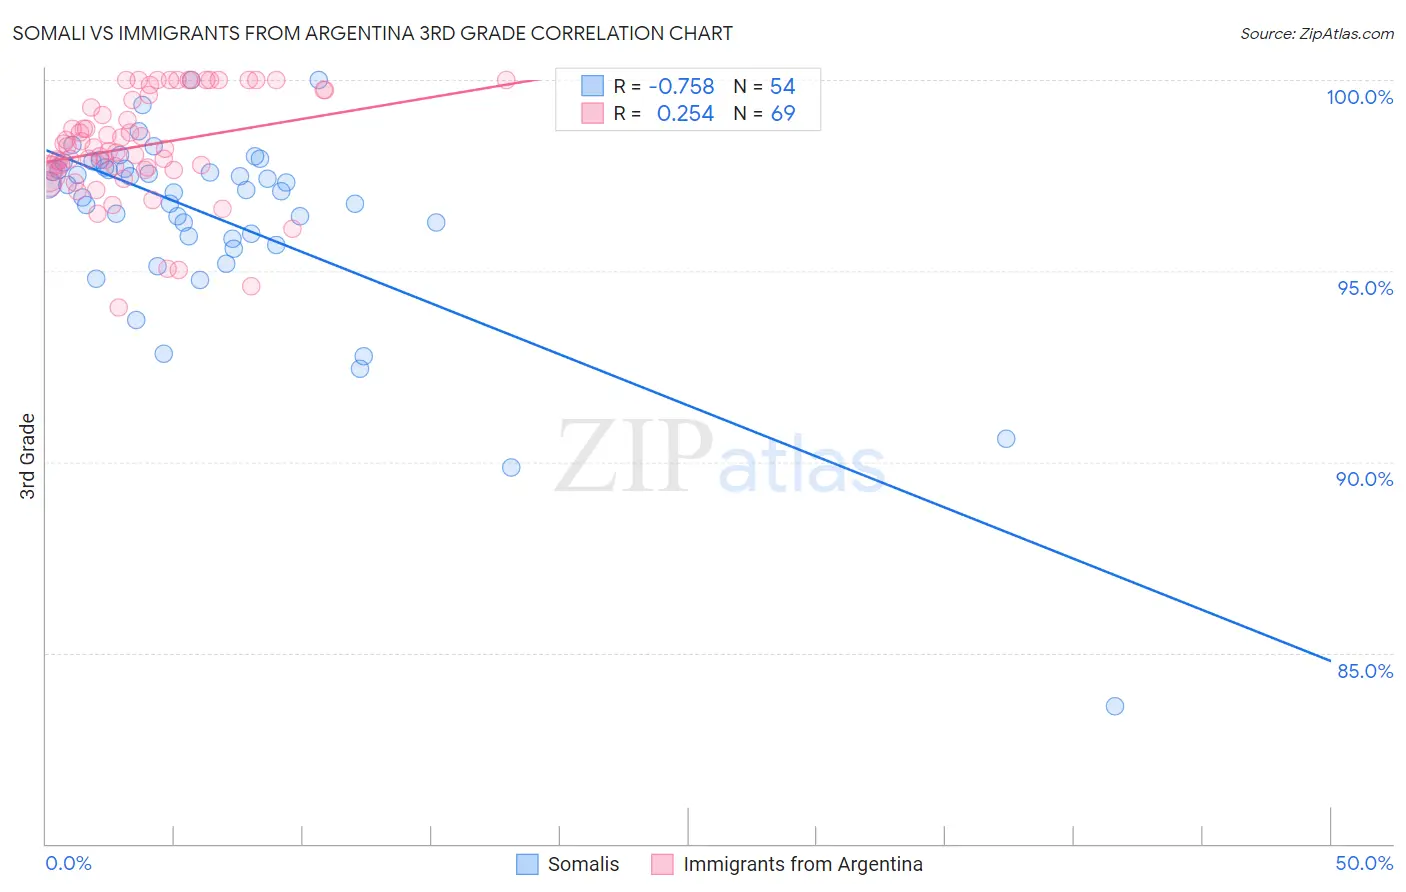
Somali vs Immigrants from Argentina 3rd Grade Correlation Chart
The statistical analysis conducted on geographies consisting of 99,332,457 people shows a strong negative correlation between the proportion of Somalis and percentage of population with at least 3rd grade education in the United States with a correlation coefficient (R) of -0.758 and weighted average of 96.8%. Similarly, the statistical analysis conducted on geographies consisting of 264,437,906 people shows a weak positive correlation between the proportion of Immigrants from Argentina and percentage of population with at least 3rd grade education in the United States with a correlation coefficient (R) of 0.254 and weighted average of 97.7%, a difference of 0.90%.
3rd Grade Correlation Summary
| Measurement | Somali | Immigrants from Argentina |
| Minimum | 83.6% | 94.0% |
| Maximum | 100.0% | 100.0% |
| Range | 16.4% | 6.0% |
| Mean | 96.3% | 98.3% |
| Median | 97.1% | 98.2% |
| Interquartile 25% (IQ1) | 95.8% | 97.6% |
| Interquartile 75% (IQ3) | 97.7% | 99.7% |
| Interquartile Range (IQR) | 1.8% | 2.0% |
| Standard Deviation (Sample) | 2.7% | 1.4% |
| Standard Deviation (Population) | 2.7% | 1.4% |
Similar Demographics by 3rd Grade
Demographics Similar to Somalis by 3rd Grade
In terms of 3rd grade, the demographic groups most similar to Somalis are Immigrants from Dominica (96.9%, a difference of 0.010%), Immigrants from South Eastern Asia (96.8%, a difference of 0.010%), Haitian (96.9%, a difference of 0.020%), Immigrants from Cuba (96.8%, a difference of 0.020%), and Immigrants (96.9%, a difference of 0.040%).
| Demographics | Rating | Rank | 3rd Grade |
| British West Indians | 0.0 /100 | #292 | Tragic 97.0% |
| Immigrants | Grenada | 0.0 /100 | #293 | Tragic 97.0% |
| Malaysians | 0.0 /100 | #294 | Tragic 97.0% |
| Immigrants | Eritrea | 0.0 /100 | #295 | Tragic 97.0% |
| Immigrants | Immigrants | 0.0 /100 | #296 | Tragic 96.9% |
| Haitians | 0.0 /100 | #297 | Tragic 96.9% |
| Immigrants | Dominica | 0.0 /100 | #298 | Tragic 96.9% |
| Somalis | 0.0 /100 | #299 | Tragic 96.8% |
| Immigrants | South Eastern Asia | 0.0 /100 | #300 | Tragic 96.8% |
| Immigrants | Cuba | 0.0 /100 | #301 | Tragic 96.8% |
| Immigrants | Somalia | 0.0 /100 | #302 | Tragic 96.8% |
| Ecuadorians | 0.0 /100 | #303 | Tragic 96.7% |
| Immigrants | Caribbean | 0.0 /100 | #304 | Tragic 96.7% |
| Central American Indians | 0.0 /100 | #305 | Tragic 96.7% |
| Guyanese | 0.0 /100 | #306 | Tragic 96.7% |
Demographics Similar to Immigrants from Argentina by 3rd Grade
In terms of 3rd grade, the demographic groups most similar to Immigrants from Argentina are Immigrants from Kazakhstan (97.7%, a difference of 0.0%), Portuguese (97.7%, a difference of 0.0%), Arab (97.7%, a difference of 0.010%), Native/Alaskan (97.7%, a difference of 0.010%), and Immigrants from Taiwan (97.7%, a difference of 0.010%).
| Demographics | Rating | Rank | 3rd Grade |
| Immigrants | Brazil | 46.4 /100 | #178 | Average 97.7% |
| Immigrants | Belarus | 45.9 /100 | #179 | Average 97.7% |
| Immigrants | Sri Lanka | 45.1 /100 | #180 | Average 97.7% |
| Immigrants | Venezuela | 44.4 /100 | #181 | Average 97.7% |
| Argentineans | 42.9 /100 | #182 | Average 97.7% |
| Arabs | 40.0 /100 | #183 | Fair 97.7% |
| Immigrants | Kazakhstan | 37.4 /100 | #184 | Fair 97.7% |
| Immigrants | Argentina | 37.0 /100 | #185 | Fair 97.7% |
| Portuguese | 36.2 /100 | #186 | Fair 97.7% |
| Natives/Alaskans | 35.2 /100 | #187 | Fair 97.7% |
| Immigrants | Taiwan | 34.2 /100 | #188 | Fair 97.7% |
| Pakistanis | 34.2 /100 | #189 | Fair 97.7% |
| Panamanians | 31.5 /100 | #190 | Fair 97.7% |
| Blacks/African Americans | 29.6 /100 | #191 | Fair 97.7% |
| Mongolians | 29.1 /100 | #192 | Fair 97.7% |