Scotch-Irish vs Immigrants from Argentina 3rd Grade
COMPARE
Scotch-Irish
Immigrants from Argentina
3rd Grade
3rd Grade Comparison
Scotch-Irish
Immigrants from Argentina
98.5%
3RD GRADE
100.0/ 100
METRIC RATING
25th/ 347
METRIC RANK
97.7%
3RD GRADE
37.0/ 100
METRIC RATING
185th/ 347
METRIC RANK
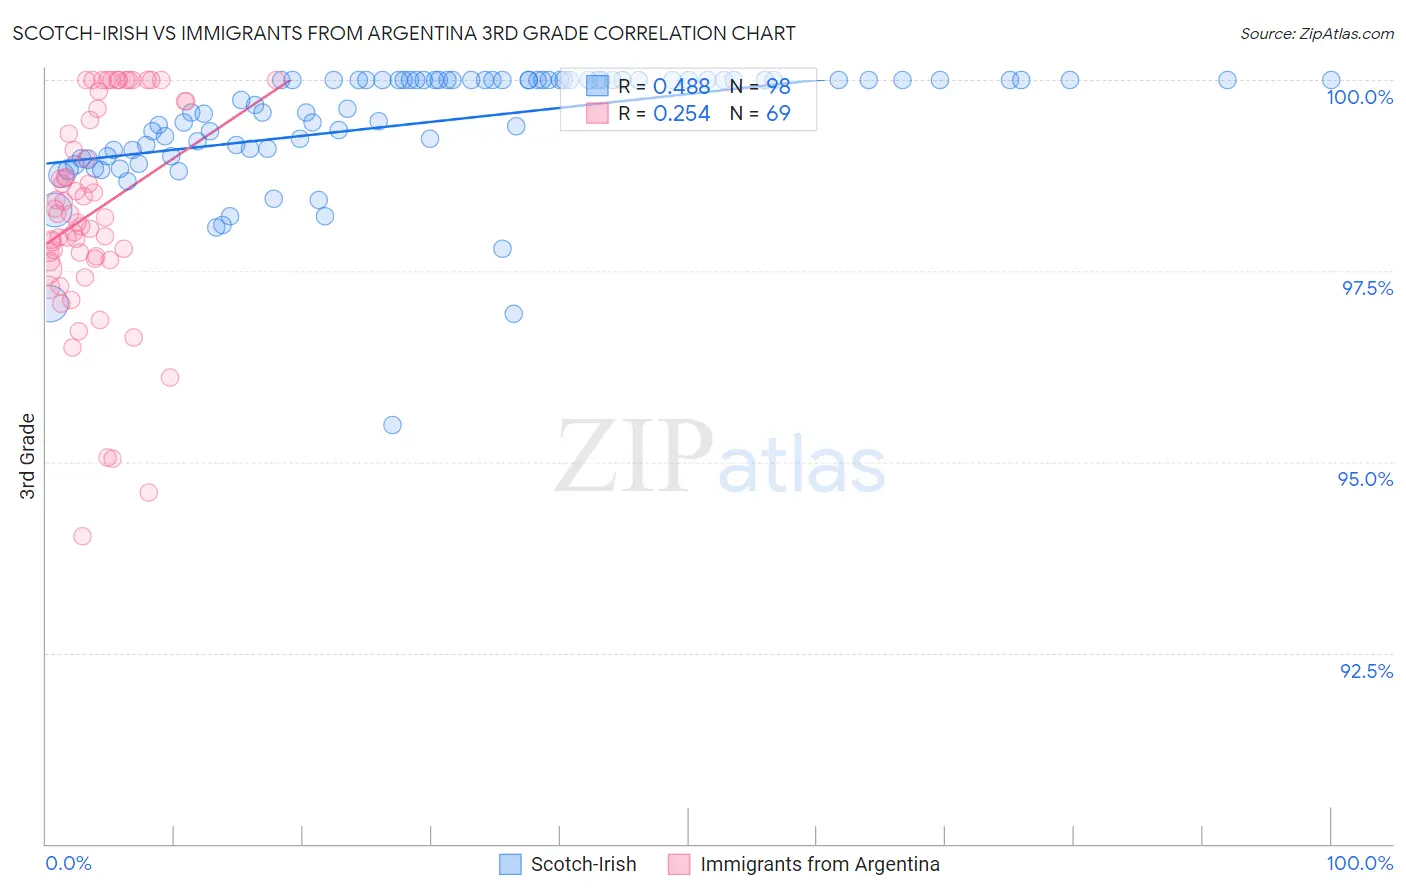
Scotch-Irish vs Immigrants from Argentina 3rd Grade Correlation Chart
The statistical analysis conducted on geographies consisting of 548,777,407 people shows a moderate positive correlation between the proportion of Scotch-Irish and percentage of population with at least 3rd grade education in the United States with a correlation coefficient (R) of 0.488 and weighted average of 98.5%. Similarly, the statistical analysis conducted on geographies consisting of 264,437,906 people shows a weak positive correlation between the proportion of Immigrants from Argentina and percentage of population with at least 3rd grade education in the United States with a correlation coefficient (R) of 0.254 and weighted average of 97.7%, a difference of 0.77%.
3rd Grade Correlation Summary
| Measurement | Scotch-Irish | Immigrants from Argentina |
| Minimum | 95.5% | 94.0% |
| Maximum | 100.0% | 100.0% |
| Range | 4.5% | 6.0% |
| Mean | 99.4% | 98.3% |
| Median | 99.9% | 98.2% |
| Interquartile 25% (IQ1) | 99.1% | 97.6% |
| Interquartile 75% (IQ3) | 100.0% | 99.7% |
| Interquartile Range (IQR) | 0.92% | 2.0% |
| Standard Deviation (Sample) | 0.79% | 1.4% |
| Standard Deviation (Population) | 0.79% | 1.4% |
Similar Demographics by 3rd Grade
Demographics Similar to Scotch-Irish by 3rd Grade
In terms of 3rd grade, the demographic groups most similar to Scotch-Irish are Danish (98.5%, a difference of 0.0%), Lithuanian (98.5%, a difference of 0.010%), Finnish (98.5%, a difference of 0.010%), Sioux (98.5%, a difference of 0.010%), and Aleut (98.5%, a difference of 0.010%).
| Demographics | Rating | Rank | 3rd Grade |
| Irish | 100.0 /100 | #18 | Exceptional 98.5% |
| Poles | 100.0 /100 | #19 | Exceptional 98.5% |
| Pennsylvania Germans | 100.0 /100 | #20 | Exceptional 98.5% |
| Lithuanians | 100.0 /100 | #21 | Exceptional 98.5% |
| Finns | 100.0 /100 | #22 | Exceptional 98.5% |
| Sioux | 100.0 /100 | #23 | Exceptional 98.5% |
| Danes | 100.0 /100 | #24 | Exceptional 98.5% |
| Scotch-Irish | 100.0 /100 | #25 | Exceptional 98.5% |
| Aleuts | 100.0 /100 | #26 | Exceptional 98.5% |
| Croatians | 100.0 /100 | #27 | Exceptional 98.5% |
| French | 100.0 /100 | #28 | Exceptional 98.4% |
| French Canadians | 100.0 /100 | #29 | Exceptional 98.4% |
| Europeans | 100.0 /100 | #30 | Exceptional 98.4% |
| Czechs | 100.0 /100 | #31 | Exceptional 98.4% |
| Scandinavians | 100.0 /100 | #32 | Exceptional 98.4% |
Demographics Similar to Immigrants from Argentina by 3rd Grade
In terms of 3rd grade, the demographic groups most similar to Immigrants from Argentina are Immigrants from Kazakhstan (97.7%, a difference of 0.0%), Portuguese (97.7%, a difference of 0.0%), Arab (97.7%, a difference of 0.010%), Native/Alaskan (97.7%, a difference of 0.010%), and Immigrants from Taiwan (97.7%, a difference of 0.010%).
| Demographics | Rating | Rank | 3rd Grade |
| Immigrants | Brazil | 46.4 /100 | #178 | Average 97.7% |
| Immigrants | Belarus | 45.9 /100 | #179 | Average 97.7% |
| Immigrants | Sri Lanka | 45.1 /100 | #180 | Average 97.7% |
| Immigrants | Venezuela | 44.4 /100 | #181 | Average 97.7% |
| Argentineans | 42.9 /100 | #182 | Average 97.7% |
| Arabs | 40.0 /100 | #183 | Fair 97.7% |
| Immigrants | Kazakhstan | 37.4 /100 | #184 | Fair 97.7% |
| Immigrants | Argentina | 37.0 /100 | #185 | Fair 97.7% |
| Portuguese | 36.2 /100 | #186 | Fair 97.7% |
| Natives/Alaskans | 35.2 /100 | #187 | Fair 97.7% |
| Immigrants | Taiwan | 34.2 /100 | #188 | Fair 97.7% |
| Pakistanis | 34.2 /100 | #189 | Fair 97.7% |
| Panamanians | 31.5 /100 | #190 | Fair 97.7% |
| Blacks/African Americans | 29.6 /100 | #191 | Fair 97.7% |
| Mongolians | 29.1 /100 | #192 | Fair 97.7% |