Immigrants from Saudi Arabia vs Dutch West Indian 6th Grade
COMPARE
Immigrants from Saudi Arabia
Dutch West Indian
6th Grade
6th Grade Comparison
Immigrants from Saudi Arabia
Dutch West Indians
97.4%
6TH GRADE
96.5/ 100
METRIC RATING
113th/ 347
METRIC RANK
96.9%
6TH GRADE
28.3/ 100
METRIC RATING
190th/ 347
METRIC RANK
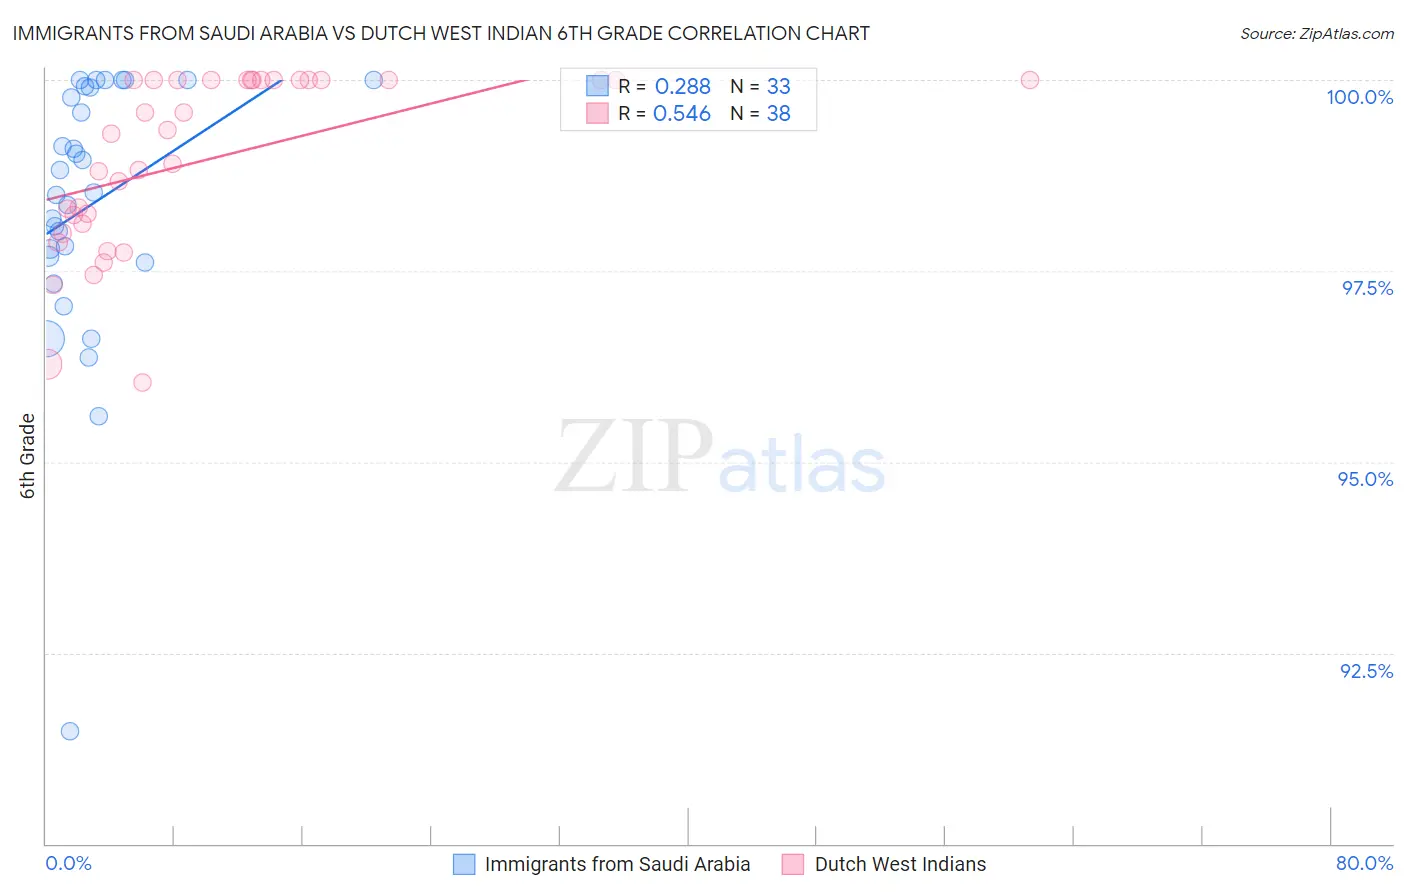
Immigrants from Saudi Arabia vs Dutch West Indian 6th Grade Correlation Chart
The statistical analysis conducted on geographies consisting of 164,277,573 people shows a weak positive correlation between the proportion of Immigrants from Saudi Arabia and percentage of population with at least 6th grade education in the United States with a correlation coefficient (R) of 0.288 and weighted average of 97.4%. Similarly, the statistical analysis conducted on geographies consisting of 85,776,075 people shows a substantial positive correlation between the proportion of Dutch West Indians and percentage of population with at least 6th grade education in the United States with a correlation coefficient (R) of 0.546 and weighted average of 96.9%, a difference of 0.48%.
6th Grade Correlation Summary
| Measurement | Immigrants from Saudi Arabia | Dutch West Indian |
| Minimum | 91.5% | 96.0% |
| Maximum | 100.0% | 100.0% |
| Range | 8.5% | 4.0% |
| Mean | 98.4% | 99.0% |
| Median | 98.5% | 99.3% |
| Interquartile 25% (IQ1) | 97.6% | 98.1% |
| Interquartile 75% (IQ3) | 99.9% | 100.0% |
| Interquartile Range (IQR) | 2.3% | 1.9% |
| Standard Deviation (Sample) | 1.8% | 1.1% |
| Standard Deviation (Population) | 1.7% | 1.1% |
Similar Demographics by 6th Grade
Demographics Similar to Immigrants from Saudi Arabia by 6th Grade
In terms of 6th grade, the demographic groups most similar to Immigrants from Saudi Arabia are Colville (97.4%, a difference of 0.0%), Iroquois (97.4%, a difference of 0.010%), Immigrants from Latvia (97.4%, a difference of 0.010%), Thai (97.4%, a difference of 0.020%), and Immigrants from Switzerland (97.4%, a difference of 0.020%).
| Demographics | Rating | Rank | 6th Grade |
| Menominee | 97.7 /100 | #106 | Exceptional 97.5% |
| Immigrants | Singapore | 97.6 /100 | #107 | Exceptional 97.5% |
| Immigrants | Nonimmigrants | 97.3 /100 | #108 | Exceptional 97.4% |
| Immigrants | Czechoslovakia | 97.3 /100 | #109 | Exceptional 97.4% |
| Thais | 96.9 /100 | #110 | Exceptional 97.4% |
| Iroquois | 96.9 /100 | #111 | Exceptional 97.4% |
| Immigrants | Latvia | 96.7 /100 | #112 | Exceptional 97.4% |
| Immigrants | Saudi Arabia | 96.5 /100 | #113 | Exceptional 97.4% |
| Colville | 96.4 /100 | #114 | Exceptional 97.4% |
| Immigrants | Switzerland | 95.7 /100 | #115 | Exceptional 97.4% |
| Lebanese | 95.5 /100 | #116 | Exceptional 97.4% |
| Basques | 95.4 /100 | #117 | Exceptional 97.4% |
| Immigrants | Japan | 95.2 /100 | #118 | Exceptional 97.4% |
| Immigrants | Zimbabwe | 95.0 /100 | #119 | Exceptional 97.4% |
| Syrians | 94.8 /100 | #120 | Exceptional 97.4% |
Demographics Similar to Dutch West Indians by 6th Grade
In terms of 6th grade, the demographic groups most similar to Dutch West Indians are Guamanian/Chamorro (97.0%, a difference of 0.010%), Immigrants from Argentina (97.0%, a difference of 0.010%), Black/African American (97.0%, a difference of 0.010%), Panamanian (96.9%, a difference of 0.010%), and Hawaiian (96.9%, a difference of 0.010%).
| Demographics | Rating | Rank | 6th Grade |
| Immigrants | Venezuela | 34.5 /100 | #183 | Fair 97.0% |
| Spanish Americans | 33.5 /100 | #184 | Fair 97.0% |
| Argentineans | 33.0 /100 | #185 | Fair 97.0% |
| Immigrants | Egypt | 31.4 /100 | #186 | Fair 97.0% |
| Guamanians/Chamorros | 30.6 /100 | #187 | Fair 97.0% |
| Immigrants | Argentina | 30.4 /100 | #188 | Fair 97.0% |
| Blacks/African Americans | 30.2 /100 | #189 | Fair 97.0% |
| Dutch West Indians | 28.3 /100 | #190 | Fair 96.9% |
| Panamanians | 27.3 /100 | #191 | Fair 96.9% |
| Hawaiians | 27.0 /100 | #192 | Fair 96.9% |
| Paraguayans | 26.6 /100 | #193 | Fair 96.9% |
| Immigrants | Lebanon | 25.6 /100 | #194 | Fair 96.9% |
| Immigrants | Brazil | 25.5 /100 | #195 | Fair 96.9% |
| Immigrants | Uganda | 21.2 /100 | #196 | Fair 96.9% |
| Brazilians | 20.1 /100 | #197 | Fair 96.9% |