Sioux vs Immigrants from Syria 5th Grade
COMPARE
Sioux
Immigrants from Syria
5th Grade
5th Grade Comparison
Sioux
Immigrants from Syria
98.2%
5TH GRADE
100.0/ 100
METRIC RATING
23rd/ 347
METRIC RANK
97.1%
5TH GRADE
6.4/ 100
METRIC RATING
219th/ 347
METRIC RANK
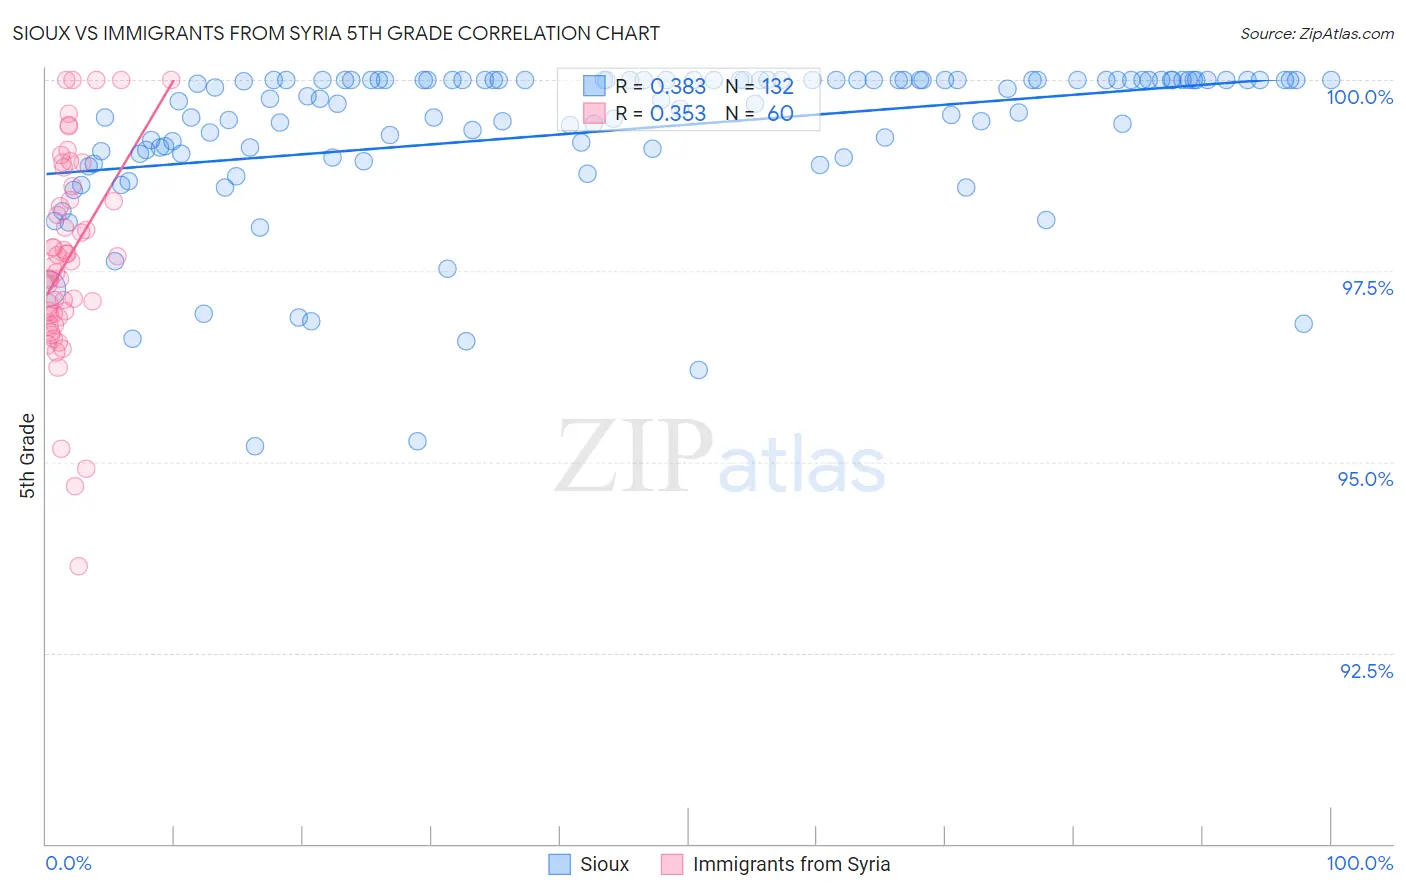
Sioux vs Immigrants from Syria 5th Grade Correlation Chart
The statistical analysis conducted on geographies consisting of 234,197,998 people shows a mild positive correlation between the proportion of Sioux and percentage of population with at least 5th grade education in the United States with a correlation coefficient (R) of 0.383 and weighted average of 98.2%. Similarly, the statistical analysis conducted on geographies consisting of 174,108,374 people shows a mild positive correlation between the proportion of Immigrants from Syria and percentage of population with at least 5th grade education in the United States with a correlation coefficient (R) of 0.353 and weighted average of 97.1%, a difference of 1.2%.
5th Grade Correlation Summary
| Measurement | Sioux | Immigrants from Syria |
| Minimum | 95.2% | 93.6% |
| Maximum | 100.0% | 100.0% |
| Range | 4.8% | 6.4% |
| Mean | 99.3% | 97.7% |
| Median | 99.8% | 97.6% |
| Interquartile 25% (IQ1) | 99.1% | 96.9% |
| Interquartile 75% (IQ3) | 100.0% | 98.5% |
| Interquartile Range (IQR) | 0.94% | 1.6% |
| Standard Deviation (Sample) | 1.0% | 1.3% |
| Standard Deviation (Population) | 1.0% | 1.3% |
Similar Demographics by 5th Grade
Demographics Similar to Sioux by 5th Grade
In terms of 5th grade, the demographic groups most similar to Sioux are Croatian (98.2%, a difference of 0.0%), Scotch-Irish (98.2%, a difference of 0.0%), Danish (98.2%, a difference of 0.010%), Yup'ik (98.2%, a difference of 0.010%), and Alaska Native (98.2%, a difference of 0.010%).
| Demographics | Rating | Rank | 5th Grade |
| Poles | 100.0 /100 | #16 | Exceptional 98.3% |
| Irish | 100.0 /100 | #17 | Exceptional 98.3% |
| Pennsylvania Germans | 100.0 /100 | #18 | Exceptional 98.3% |
| Finns | 100.0 /100 | #19 | Exceptional 98.2% |
| Lithuanians | 100.0 /100 | #20 | Exceptional 98.2% |
| Danes | 100.0 /100 | #21 | Exceptional 98.2% |
| Croatians | 100.0 /100 | #22 | Exceptional 98.2% |
| Sioux | 100.0 /100 | #23 | Exceptional 98.2% |
| Scotch-Irish | 100.0 /100 | #24 | Exceptional 98.2% |
| Yup'ik | 100.0 /100 | #25 | Exceptional 98.2% |
| Alaska Natives | 100.0 /100 | #26 | Exceptional 98.2% |
| French | 100.0 /100 | #27 | Exceptional 98.2% |
| Czechs | 100.0 /100 | #28 | Exceptional 98.2% |
| Scandinavians | 100.0 /100 | #29 | Exceptional 98.2% |
| French Canadians | 100.0 /100 | #30 | Exceptional 98.2% |
Demographics Similar to Immigrants from Syria by 5th Grade
In terms of 5th grade, the demographic groups most similar to Immigrants from Syria are Immigrants from Sudan (97.1%, a difference of 0.0%), Immigrants from Southern Europe (97.1%, a difference of 0.0%), Sudanese (97.1%, a difference of 0.010%), Immigrants from Lebanon (97.1%, a difference of 0.010%), and Sierra Leonean (97.1%, a difference of 0.010%).
| Demographics | Rating | Rank | 5th Grade |
| Immigrants | Iraq | 8.3 /100 | #212 | Tragic 97.1% |
| Portuguese | 7.8 /100 | #213 | Tragic 97.1% |
| Costa Ricans | 7.7 /100 | #214 | Tragic 97.1% |
| Immigrants | Morocco | 7.5 /100 | #215 | Tragic 97.1% |
| Sudanese | 7.0 /100 | #216 | Tragic 97.1% |
| Immigrants | Lebanon | 6.8 /100 | #217 | Tragic 97.1% |
| Immigrants | Sudan | 6.5 /100 | #218 | Tragic 97.1% |
| Immigrants | Syria | 6.4 /100 | #219 | Tragic 97.1% |
| Immigrants | Southern Europe | 6.3 /100 | #220 | Tragic 97.1% |
| Sierra Leoneans | 6.0 /100 | #221 | Tragic 97.1% |
| Immigrants | Panama | 5.7 /100 | #222 | Tragic 97.0% |
| Liberians | 5.7 /100 | #223 | Tragic 97.0% |
| South American Indians | 5.4 /100 | #224 | Tragic 97.0% |
| Bahamians | 5.3 /100 | #225 | Tragic 97.0% |
| Tongans | 5.3 /100 | #226 | Tragic 97.0% |