Sioux vs Argentinean College, Under 1 year
COMPARE
Sioux
Argentinean
College, Under 1 year
College, Under 1 year Comparison
Sioux
Argentineans
59.4%
COLLEGE, UNDER 1 YEAR
0.0/ 100
METRIC RATING
287th/ 347
METRIC RANK
68.4%
COLLEGE, UNDER 1 YEAR
98.4/ 100
METRIC RATING
83rd/ 347
METRIC RANK
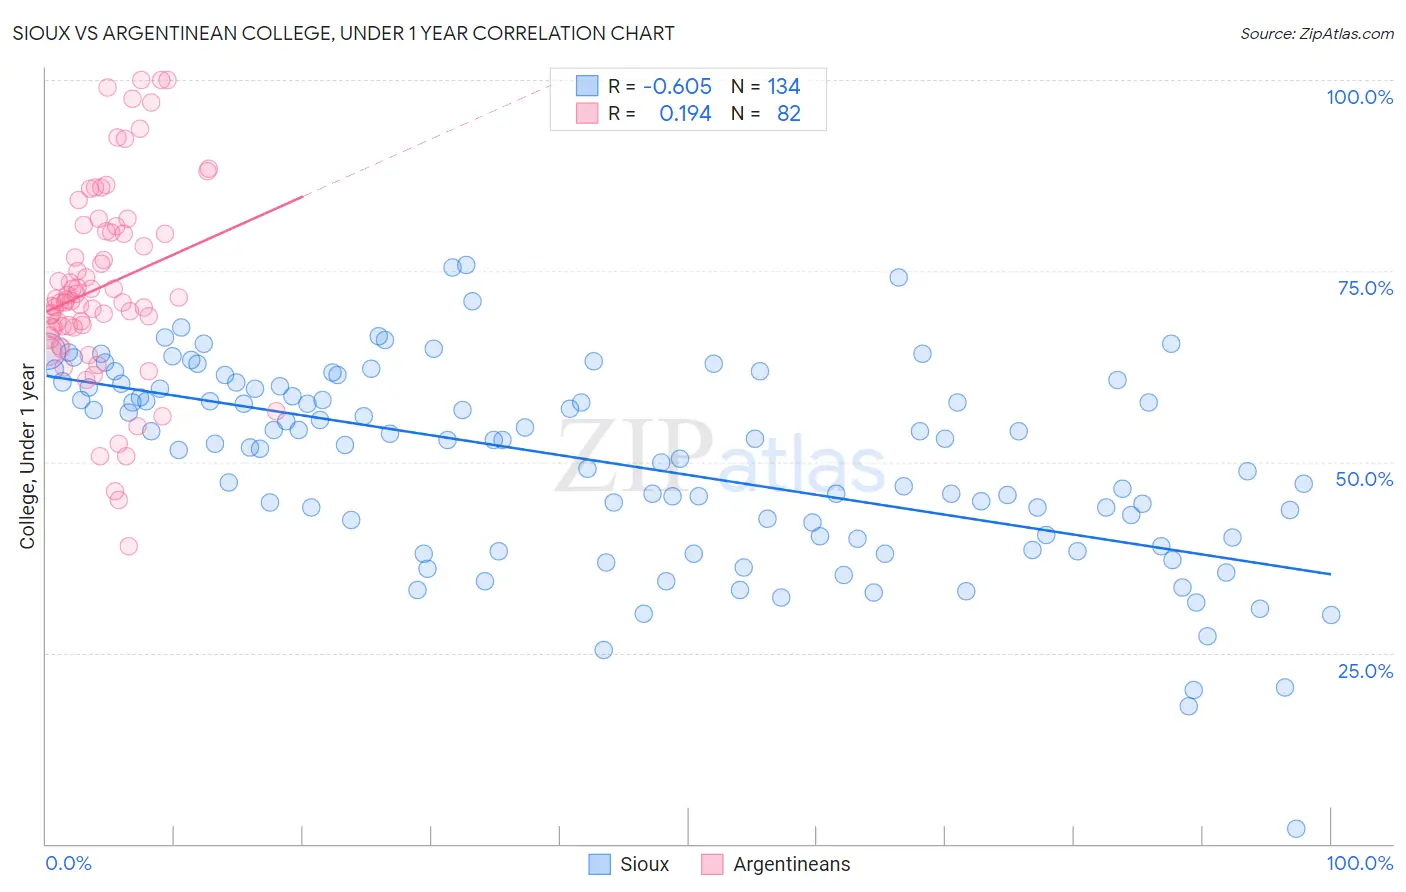
Sioux vs Argentinean College, Under 1 year Correlation Chart
The statistical analysis conducted on geographies consisting of 234,200,116 people shows a significant negative correlation between the proportion of Sioux and percentage of population with at least college, under 1 year education in the United States with a correlation coefficient (R) of -0.605 and weighted average of 59.4%. Similarly, the statistical analysis conducted on geographies consisting of 297,139,739 people shows a poor positive correlation between the proportion of Argentineans and percentage of population with at least college, under 1 year education in the United States with a correlation coefficient (R) of 0.194 and weighted average of 68.4%, a difference of 15.0%.
College, Under 1 year Correlation Summary
| Measurement | Sioux | Argentinean |
| Minimum | 2.0% | 38.9% |
| Maximum | 75.8% | 100.0% |
| Range | 73.8% | 61.1% |
| Mean | 50.0% | 73.0% |
| Median | 52.8% | 71.1% |
| Interquartile 25% (IQ1) | 40.2% | 67.5% |
| Interquartile 75% (IQ3) | 59.9% | 80.2% |
| Interquartile Range (IQR) | 19.7% | 12.7% |
| Standard Deviation (Sample) | 12.9% | 12.8% |
| Standard Deviation (Population) | 12.9% | 12.7% |
Similar Demographics by College, Under 1 year
Demographics Similar to Sioux by College, Under 1 year
In terms of college, under 1 year, the demographic groups most similar to Sioux are Black/African American (59.4%, a difference of 0.10%), British West Indian (59.5%, a difference of 0.17%), Choctaw (59.3%, a difference of 0.17%), Ecuadorian (59.3%, a difference of 0.21%), and Creek (59.3%, a difference of 0.29%).
| Demographics | Rating | Rank | College, Under 1 year |
| Crow | 0.1 /100 | #280 | Tragic 60.2% |
| Cherokee | 0.1 /100 | #281 | Tragic 60.1% |
| Belizeans | 0.1 /100 | #282 | Tragic 60.1% |
| Immigrants | Jamaica | 0.0 /100 | #283 | Tragic 59.7% |
| Immigrants | St. Vincent and the Grenadines | 0.0 /100 | #284 | Tragic 59.6% |
| Paiute | 0.0 /100 | #285 | Tragic 59.6% |
| British West Indians | 0.0 /100 | #286 | Tragic 59.5% |
| Sioux | 0.0 /100 | #287 | Tragic 59.4% |
| Blacks/African Americans | 0.0 /100 | #288 | Tragic 59.4% |
| Choctaw | 0.0 /100 | #289 | Tragic 59.3% |
| Ecuadorians | 0.0 /100 | #290 | Tragic 59.3% |
| Creek | 0.0 /100 | #291 | Tragic 59.3% |
| Nicaraguans | 0.0 /100 | #292 | Tragic 59.2% |
| Seminole | 0.0 /100 | #293 | Tragic 59.1% |
| Immigrants | Belize | 0.0 /100 | #294 | Tragic 59.1% |
Demographics Similar to Argentineans by College, Under 1 year
In terms of college, under 1 year, the demographic groups most similar to Argentineans are Norwegian (68.4%, a difference of 0.020%), Immigrants from Hungary (68.3%, a difference of 0.020%), Egyptian (68.3%, a difference of 0.030%), Immigrants from Lebanon (68.3%, a difference of 0.030%), and Chinese (68.3%, a difference of 0.050%).
| Demographics | Rating | Rank | College, Under 1 year |
| Laotians | 98.6 /100 | #76 | Exceptional 68.5% |
| British | 98.6 /100 | #77 | Exceptional 68.5% |
| Danes | 98.6 /100 | #78 | Exceptional 68.5% |
| Greeks | 98.6 /100 | #79 | Exceptional 68.5% |
| Immigrants | Spain | 98.5 /100 | #80 | Exceptional 68.4% |
| Immigrants | Greece | 98.5 /100 | #81 | Exceptional 68.4% |
| Norwegians | 98.4 /100 | #82 | Exceptional 68.4% |
| Argentineans | 98.4 /100 | #83 | Exceptional 68.4% |
| Immigrants | Hungary | 98.3 /100 | #84 | Exceptional 68.3% |
| Egyptians | 98.3 /100 | #85 | Exceptional 68.3% |
| Immigrants | Lebanon | 98.3 /100 | #86 | Exceptional 68.3% |
| Chinese | 98.3 /100 | #87 | Exceptional 68.3% |
| Croatians | 98.2 /100 | #88 | Exceptional 68.3% |
| Ethiopians | 98.2 /100 | #89 | Exceptional 68.3% |
| Icelanders | 98.1 /100 | #90 | Exceptional 68.3% |