French American Indian vs Immigrants from Zimbabwe Master's Degree
COMPARE
French American Indian
Immigrants from Zimbabwe
Master's Degree
Master's Degree Comparison
French American Indians
Immigrants from Zimbabwe
12.7%
MASTER'S DEGREE
1.0/ 100
METRIC RATING
252nd/ 347
METRIC RANK
17.4%
MASTER'S DEGREE
99.5/ 100
METRIC RATING
83rd/ 347
METRIC RANK
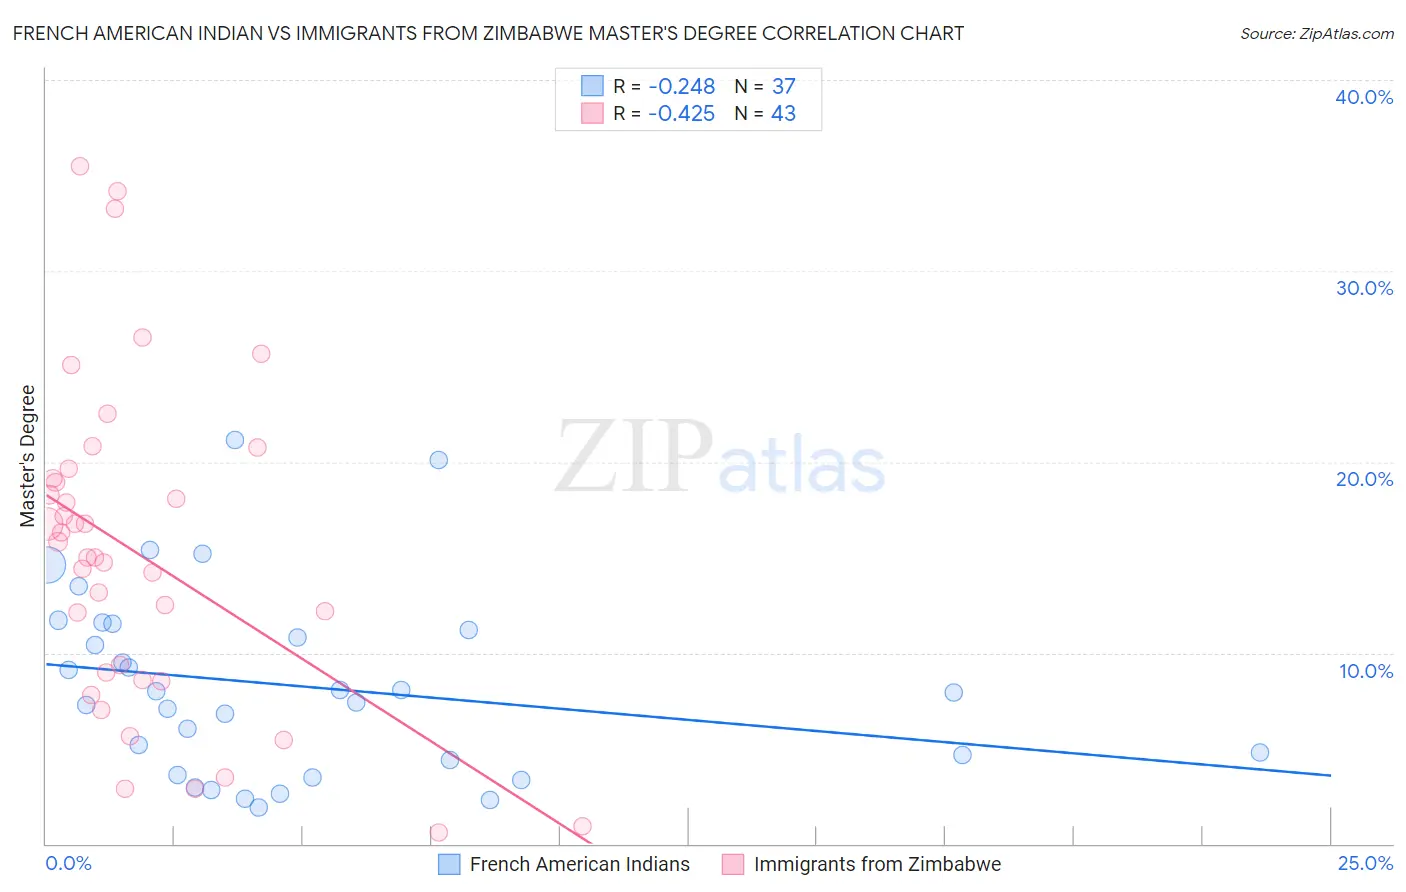
French American Indian vs Immigrants from Zimbabwe Master's Degree Correlation Chart
The statistical analysis conducted on geographies consisting of 131,966,823 people shows a weak negative correlation between the proportion of French American Indians and percentage of population with at least master's degree education in the United States with a correlation coefficient (R) of -0.248 and weighted average of 12.7%. Similarly, the statistical analysis conducted on geographies consisting of 117,807,833 people shows a moderate negative correlation between the proportion of Immigrants from Zimbabwe and percentage of population with at least master's degree education in the United States with a correlation coefficient (R) of -0.425 and weighted average of 17.4%, a difference of 37.2%.
Master's Degree Correlation Summary
| Measurement | French American Indian | Immigrants from Zimbabwe |
| Minimum | 1.9% | 0.61% |
| Maximum | 21.1% | 35.5% |
| Range | 19.2% | 34.9% |
| Mean | 8.3% | 15.1% |
| Median | 7.9% | 15.0% |
| Interquartile 25% (IQ1) | 4.0% | 8.6% |
| Interquartile 75% (IQ3) | 11.4% | 19.1% |
| Interquartile Range (IQR) | 7.4% | 10.5% |
| Standard Deviation (Sample) | 4.9% | 8.4% |
| Standard Deviation (Population) | 4.8% | 8.3% |
Similar Demographics by Master's Degree
Demographics Similar to French American Indians by Master's Degree
In terms of master's degree, the demographic groups most similar to French American Indians are Immigrants from Dominica (12.6%, a difference of 0.54%), Indonesian (12.6%, a difference of 0.59%), Immigrants from Congo (12.6%, a difference of 0.61%), Immigrants from Portugal (12.6%, a difference of 0.69%), and Tlingit-Haida (12.8%, a difference of 0.98%).
| Demographics | Rating | Rank | Master's Degree |
| Immigrants | Bahamas | 1.4 /100 | #245 | Tragic 12.9% |
| Immigrants | Cambodia | 1.4 /100 | #246 | Tragic 12.9% |
| Iroquois | 1.4 /100 | #247 | Tragic 12.9% |
| Africans | 1.4 /100 | #248 | Tragic 12.9% |
| Cree | 1.3 /100 | #249 | Tragic 12.8% |
| Liberians | 1.3 /100 | #250 | Tragic 12.8% |
| Tlingit-Haida | 1.3 /100 | #251 | Tragic 12.8% |
| French American Indians | 1.0 /100 | #252 | Tragic 12.7% |
| Immigrants | Dominica | 0.8 /100 | #253 | Tragic 12.6% |
| Indonesians | 0.8 /100 | #254 | Tragic 12.6% |
| Immigrants | Congo | 0.8 /100 | #255 | Tragic 12.6% |
| Immigrants | Portugal | 0.8 /100 | #256 | Tragic 12.6% |
| Osage | 0.7 /100 | #257 | Tragic 12.6% |
| Immigrants | Liberia | 0.6 /100 | #258 | Tragic 12.5% |
| Japanese | 0.6 /100 | #259 | Tragic 12.5% |
Demographics Similar to Immigrants from Zimbabwe by Master's Degree
In terms of master's degree, the demographic groups most similar to Immigrants from Zimbabwe are Greek (17.5%, a difference of 0.050%), Immigrants from Western Asia (17.5%, a difference of 0.11%), Immigrants from Scotland (17.4%, a difference of 0.33%), Carpatho Rusyn (17.5%, a difference of 0.40%), and Immigrants from Lebanon (17.5%, a difference of 0.46%).
| Demographics | Rating | Rank | Master's Degree |
| Immigrants | Indonesia | 99.6 /100 | #76 | Exceptional 17.6% |
| Immigrants | Eastern Europe | 99.6 /100 | #77 | Exceptional 17.6% |
| Immigrants | Hungary | 99.6 /100 | #78 | Exceptional 17.5% |
| Immigrants | Lebanon | 99.6 /100 | #79 | Exceptional 17.5% |
| Carpatho Rusyns | 99.6 /100 | #80 | Exceptional 17.5% |
| Immigrants | Western Asia | 99.5 /100 | #81 | Exceptional 17.5% |
| Greeks | 99.5 /100 | #82 | Exceptional 17.5% |
| Immigrants | Zimbabwe | 99.5 /100 | #83 | Exceptional 17.4% |
| Immigrants | Scotland | 99.4 /100 | #84 | Exceptional 17.4% |
| Immigrants | Brazil | 99.4 /100 | #85 | Exceptional 17.4% |
| Immigrants | Croatia | 99.3 /100 | #86 | Exceptional 17.3% |
| Maltese | 99.3 /100 | #87 | Exceptional 17.3% |
| Immigrants | Canada | 99.2 /100 | #88 | Exceptional 17.2% |
| Bhutanese | 99.1 /100 | #89 | Exceptional 17.2% |
| Immigrants | Egypt | 99.1 /100 | #90 | Exceptional 17.2% |