Sioux vs Immigrants from China Unemployment Among Seniors over 75 years
COMPARE
Sioux
Immigrants from China
Unemployment Among Seniors over 75 years
Unemployment Among Seniors over 75 years Comparison
Sioux
Immigrants from China
9.7%
UNEMPLOYMENT AMONG SENIORS OVER 75 YEARS
0.0/ 100
METRIC RATING
290th/ 347
METRIC RANK
7.8%
UNEMPLOYMENT AMONG SENIORS OVER 75 YEARS
100.0/ 100
METRIC RATING
46th/ 347
METRIC RANK
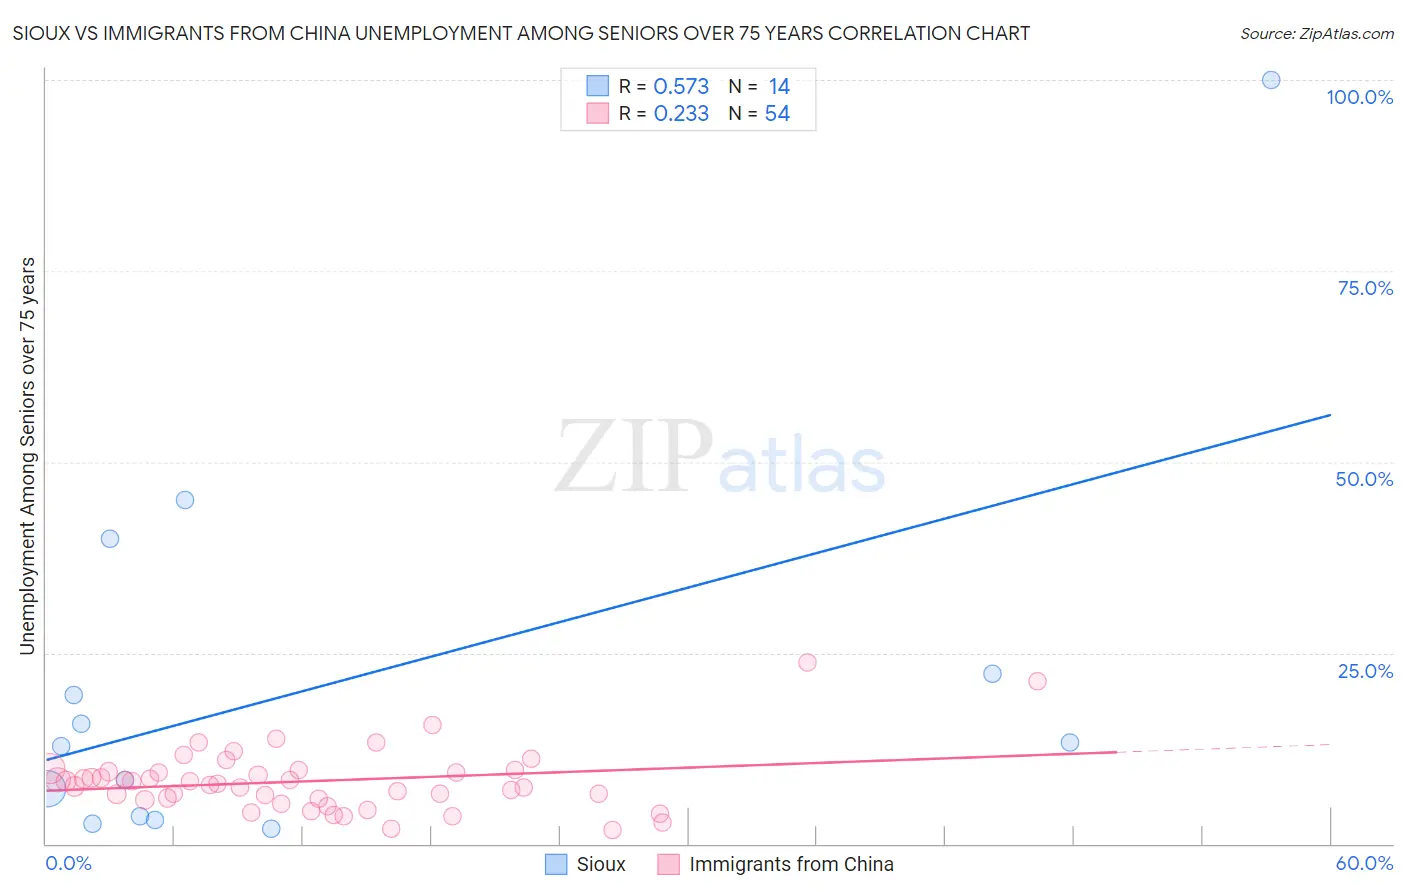
Sioux vs Immigrants from China Unemployment Among Seniors over 75 years Correlation Chart
The statistical analysis conducted on geographies consisting of 135,333,642 people shows a substantial positive correlation between the proportion of Sioux and unemployment rate among seniors over the age of 75 in the United States with a correlation coefficient (R) of 0.573 and weighted average of 9.7%. Similarly, the statistical analysis conducted on geographies consisting of 217,998,240 people shows a weak positive correlation between the proportion of Immigrants from China and unemployment rate among seniors over the age of 75 in the United States with a correlation coefficient (R) of 0.233 and weighted average of 7.8%, a difference of 24.9%.
Unemployment Among Seniors over 75 years Correlation Summary
| Measurement | Sioux | Immigrants from China |
| Minimum | 1.9% | 1.8% |
| Maximum | 100.0% | 23.8% |
| Range | 98.1% | 22.0% |
| Mean | 21.1% | 8.2% |
| Median | 13.0% | 8.0% |
| Interquartile 25% (IQ1) | 3.6% | 5.8% |
| Interquartile 75% (IQ3) | 22.2% | 9.4% |
| Interquartile Range (IQR) | 18.6% | 3.6% |
| Standard Deviation (Sample) | 26.3% | 4.1% |
| Standard Deviation (Population) | 25.4% | 4.1% |
Similar Demographics by Unemployment Among Seniors over 75 years
Demographics Similar to Sioux by Unemployment Among Seniors over 75 years
In terms of unemployment among seniors over 75 years, the demographic groups most similar to Sioux are Czech (9.7%, a difference of 0.070%), Canadian (9.7%, a difference of 0.15%), Danish (9.7%, a difference of 0.29%), Scandinavian (9.7%, a difference of 0.38%), and Nigerian (9.7%, a difference of 0.40%).
| Demographics | Rating | Rank | Unemployment Among Seniors over 75 years |
| Immigrants | Nigeria | 0.0 /100 | #283 | Tragic 9.6% |
| Europeans | 0.0 /100 | #284 | Tragic 9.7% |
| Carpatho Rusyns | 0.0 /100 | #285 | Tragic 9.7% |
| Nigerians | 0.0 /100 | #286 | Tragic 9.7% |
| Danes | 0.0 /100 | #287 | Tragic 9.7% |
| Canadians | 0.0 /100 | #288 | Tragic 9.7% |
| Czechs | 0.0 /100 | #289 | Tragic 9.7% |
| Sioux | 0.0 /100 | #290 | Tragic 9.7% |
| Scandinavians | 0.0 /100 | #291 | Tragic 9.7% |
| Immigrants | Western Africa | 0.0 /100 | #292 | Tragic 9.8% |
| Norwegians | 0.0 /100 | #293 | Tragic 9.8% |
| Immigrants | Dominica | 0.0 /100 | #294 | Tragic 9.8% |
| Immigrants | Nonimmigrants | 0.0 /100 | #295 | Tragic 9.8% |
| Immigrants | St. Vincent and the Grenadines | 0.0 /100 | #296 | Tragic 9.8% |
| Cherokee | 0.0 /100 | #297 | Tragic 9.8% |
Demographics Similar to Immigrants from China by Unemployment Among Seniors over 75 years
In terms of unemployment among seniors over 75 years, the demographic groups most similar to Immigrants from China are British West Indian (7.8%, a difference of 0.060%), Immigrants from Spain (7.8%, a difference of 0.070%), Immigrants from Denmark (7.8%, a difference of 0.11%), Pueblo (7.7%, a difference of 0.40%), and Creek (7.8%, a difference of 0.41%).
| Demographics | Rating | Rank | Unemployment Among Seniors over 75 years |
| Ugandans | 100.0 /100 | #39 | Exceptional 7.7% |
| Colville | 100.0 /100 | #40 | Exceptional 7.7% |
| Immigrants | Burma/Myanmar | 100.0 /100 | #41 | Exceptional 7.7% |
| Pueblo | 100.0 /100 | #42 | Exceptional 7.7% |
| Immigrants | Denmark | 100.0 /100 | #43 | Exceptional 7.8% |
| Immigrants | Spain | 100.0 /100 | #44 | Exceptional 7.8% |
| British West Indians | 100.0 /100 | #45 | Exceptional 7.8% |
| Immigrants | China | 100.0 /100 | #46 | Exceptional 7.8% |
| Creek | 100.0 /100 | #47 | Exceptional 7.8% |
| Immigrants | Chile | 100.0 /100 | #48 | Exceptional 7.8% |
| Potawatomi | 100.0 /100 | #49 | Exceptional 7.8% |
| Immigrants | Latvia | 100.0 /100 | #50 | Exceptional 7.8% |
| Moroccans | 100.0 /100 | #51 | Exceptional 7.8% |
| Bahamians | 100.0 /100 | #52 | Exceptional 7.8% |
| Immigrants | Egypt | 100.0 /100 | #53 | Exceptional 7.9% |