Sierra Leonean vs Japanese 1st Grade
COMPARE
Sierra Leonean
Japanese
1st Grade
1st Grade Comparison
Sierra Leoneans
Japanese
97.7%
1ST GRADE
3.6/ 100
METRIC RATING
227th/ 347
METRIC RANK
96.6%
1ST GRADE
0.0/ 100
METRIC RATING
329th/ 347
METRIC RANK
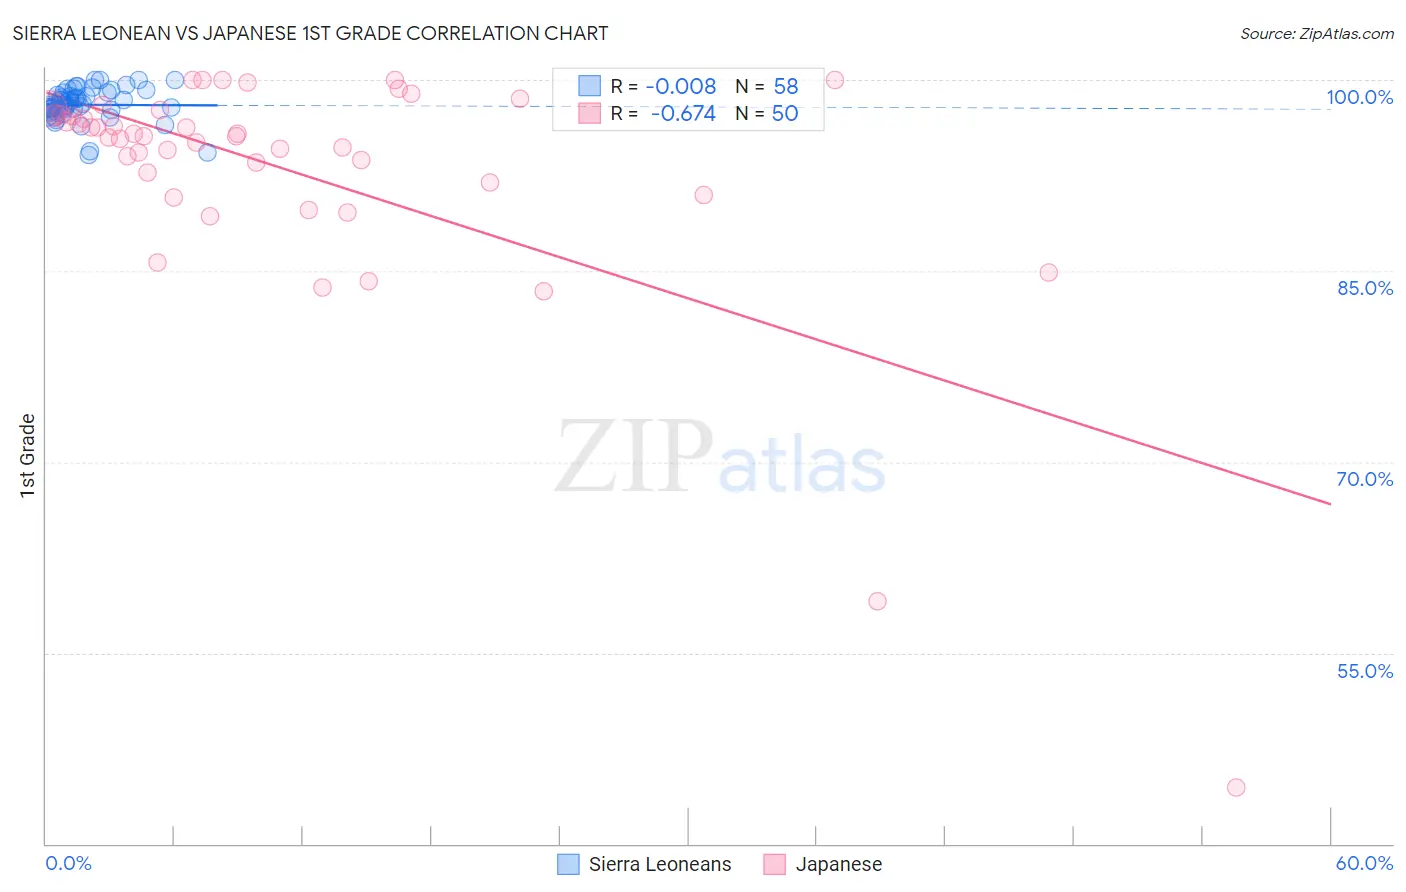
Sierra Leonean vs Japanese 1st Grade Correlation Chart
The statistical analysis conducted on geographies consisting of 83,337,655 people shows no correlation between the proportion of Sierra Leoneans and percentage of population with at least 1st grade education in the United States with a correlation coefficient (R) of -0.008 and weighted average of 97.7%. Similarly, the statistical analysis conducted on geographies consisting of 249,183,224 people shows a significant negative correlation between the proportion of Japanese and percentage of population with at least 1st grade education in the United States with a correlation coefficient (R) of -0.674 and weighted average of 96.6%, a difference of 1.1%.
1st Grade Correlation Summary
| Measurement | Sierra Leonean | Japanese |
| Minimum | 94.1% | 44.4% |
| Maximum | 100.0% | 100.0% |
| Range | 5.9% | 55.6% |
| Mean | 98.1% | 92.9% |
| Median | 98.0% | 95.6% |
| Interquartile 25% (IQ1) | 97.6% | 92.0% |
| Interquartile 75% (IQ3) | 98.8% | 97.3% |
| Interquartile Range (IQR) | 1.2% | 5.3% |
| Standard Deviation (Sample) | 1.3% | 9.7% |
| Standard Deviation (Population) | 1.3% | 9.6% |
Similar Demographics by 1st Grade
Demographics Similar to Sierra Leoneans by 1st Grade
In terms of 1st grade, the demographic groups most similar to Sierra Leoneans are Sudanese (97.7%, a difference of 0.0%), Subsaharan African (97.7%, a difference of 0.0%), Immigrants from Costa Rica (97.7%, a difference of 0.0%), Senegalese (97.7%, a difference of 0.0%), and Immigrants from Sudan (97.7%, a difference of 0.010%).
| Demographics | Rating | Rank | 1st Grade |
| Tongans | 4.6 /100 | #220 | Tragic 97.7% |
| Immigrants | Sudan | 4.3 /100 | #221 | Tragic 97.7% |
| Immigrants | Syria | 4.2 /100 | #222 | Tragic 97.7% |
| Immigrants | Zaire | 4.1 /100 | #223 | Tragic 97.7% |
| Iraqis | 4.0 /100 | #224 | Tragic 97.7% |
| Immigrants | Nepal | 4.0 /100 | #225 | Tragic 97.7% |
| Sudanese | 3.7 /100 | #226 | Tragic 97.7% |
| Sierra Leoneans | 3.6 /100 | #227 | Tragic 97.7% |
| Sub-Saharan Africans | 3.6 /100 | #228 | Tragic 97.7% |
| Immigrants | Costa Rica | 3.5 /100 | #229 | Tragic 97.7% |
| Senegalese | 3.5 /100 | #230 | Tragic 97.7% |
| Puerto Ricans | 3.0 /100 | #231 | Tragic 97.7% |
| Immigrants | Uruguay | 2.5 /100 | #232 | Tragic 97.6% |
| Immigrants | Pakistan | 2.2 /100 | #233 | Tragic 97.6% |
| Colombians | 2.2 /100 | #234 | Tragic 97.6% |
Demographics Similar to Japanese by 1st Grade
In terms of 1st grade, the demographic groups most similar to Japanese are Immigrants from Vietnam (96.6%, a difference of 0.010%), Immigrants from Armenia (96.6%, a difference of 0.030%), Immigrants from Latin America (96.7%, a difference of 0.040%), Mexican (96.7%, a difference of 0.050%), and Central American (96.5%, a difference of 0.070%).
| Demographics | Rating | Rank | 1st Grade |
| Mexican American Indians | 0.0 /100 | #322 | Tragic 96.8% |
| Immigrants | Honduras | 0.0 /100 | #323 | Tragic 96.8% |
| Vietnamese | 0.0 /100 | #324 | Tragic 96.8% |
| Dominicans | 0.0 /100 | #325 | Tragic 96.7% |
| Indonesians | 0.0 /100 | #326 | Tragic 96.7% |
| Mexicans | 0.0 /100 | #327 | Tragic 96.7% |
| Immigrants | Latin America | 0.0 /100 | #328 | Tragic 96.7% |
| Japanese | 0.0 /100 | #329 | Tragic 96.6% |
| Immigrants | Vietnam | 0.0 /100 | #330 | Tragic 96.6% |
| Immigrants | Armenia | 0.0 /100 | #331 | Tragic 96.6% |
| Central Americans | 0.0 /100 | #332 | Tragic 96.5% |
| Immigrants | Dominican Republic | 0.0 /100 | #333 | Tragic 96.5% |
| Bangladeshis | 0.0 /100 | #334 | Tragic 96.5% |
| Yakama | 0.0 /100 | #335 | Tragic 96.5% |
| Guatemalans | 0.0 /100 | #336 | Tragic 96.5% |