Serbian vs Sioux Female Poverty Among 18-24 Year Olds
COMPARE
Serbian
Sioux
Female Poverty Among 18-24 Year Olds
Female Poverty Among 18-24 Year Olds Comparison
Serbians
Sioux
19.1%
FEMALE POVERTY AMONG 18-24 YEAR OLDS
98.0/ 100
METRIC RATING
103rd/ 347
METRIC RANK
28.6%
FEMALE POVERTY AMONG 18-24 YEAR OLDS
0.0/ 100
METRIC RATING
340th/ 347
METRIC RANK
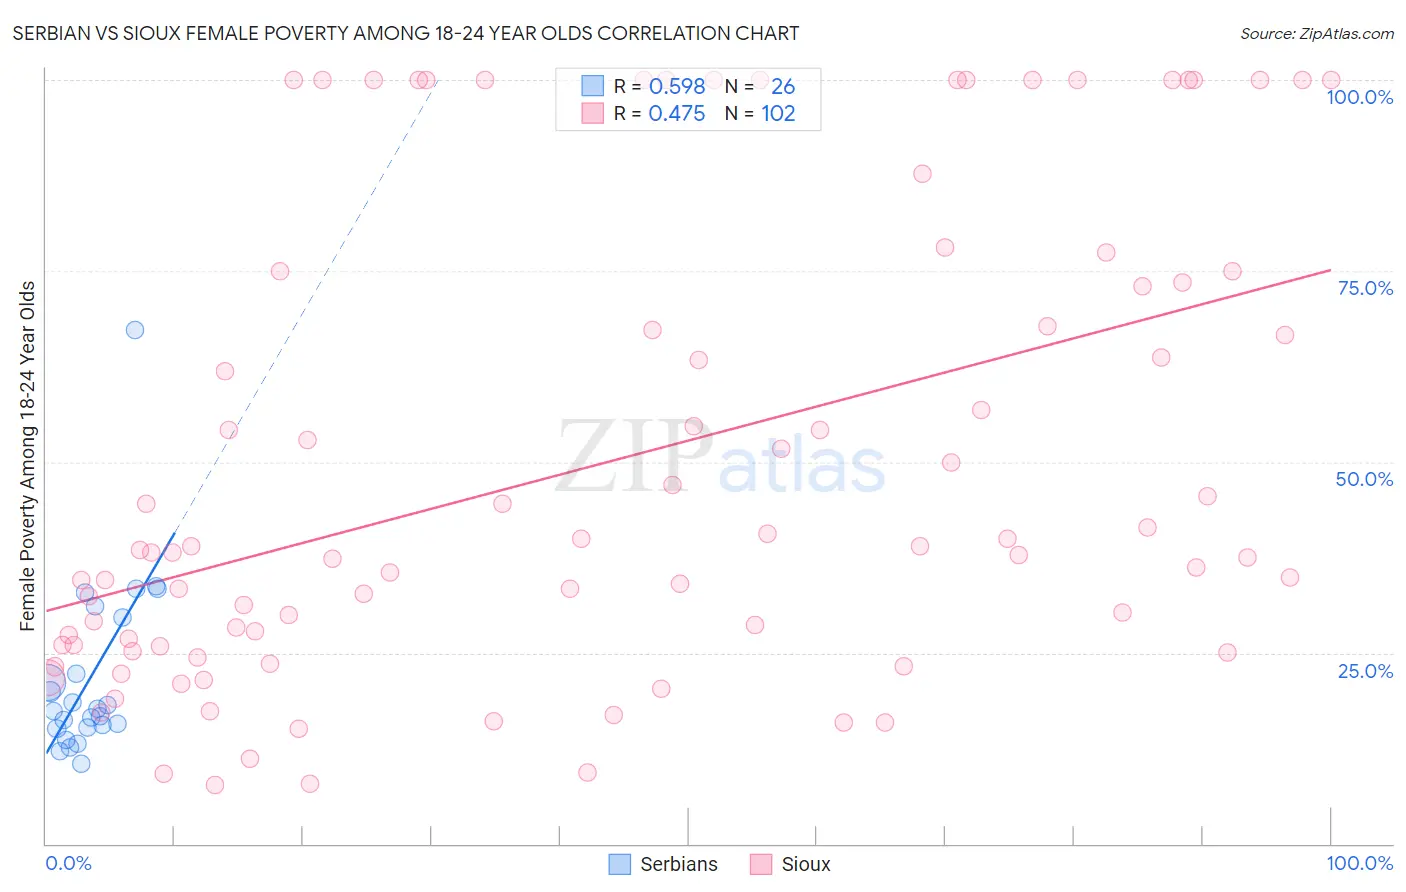
Serbian vs Sioux Female Poverty Among 18-24 Year Olds Correlation Chart
The statistical analysis conducted on geographies consisting of 262,500,209 people shows a substantial positive correlation between the proportion of Serbians and poverty level among females between the ages 18 and 24 in the United States with a correlation coefficient (R) of 0.598 and weighted average of 19.1%. Similarly, the statistical analysis conducted on geographies consisting of 230,923,136 people shows a moderate positive correlation between the proportion of Sioux and poverty level among females between the ages 18 and 24 in the United States with a correlation coefficient (R) of 0.475 and weighted average of 28.6%, a difference of 49.2%.
Female Poverty Among 18-24 Year Olds Correlation Summary
| Measurement | Serbian | Sioux |
| Minimum | 10.5% | 7.7% |
| Maximum | 67.3% | 100.0% |
| Range | 56.8% | 92.3% |
| Mean | 21.9% | 49.6% |
| Median | 17.5% | 38.3% |
| Interquartile 25% (IQ1) | 15.2% | 26.1% |
| Interquartile 75% (IQ3) | 29.6% | 73.5% |
| Interquartile Range (IQR) | 14.4% | 47.4% |
| Standard Deviation (Sample) | 11.8% | 30.2% |
| Standard Deviation (Population) | 11.6% | 30.0% |
Similar Demographics by Female Poverty Among 18-24 Year Olds
Demographics Similar to Serbians by Female Poverty Among 18-24 Year Olds
In terms of female poverty among 18-24 year olds, the demographic groups most similar to Serbians are Immigrants from Caribbean (19.1%, a difference of 0.040%), Immigrants from Afghanistan (19.1%, a difference of 0.040%), Ecuadorian (19.1%, a difference of 0.070%), Immigrants from Ecuador (19.2%, a difference of 0.13%), and Chilean (19.1%, a difference of 0.15%).
| Demographics | Rating | Rank | Female Poverty Among 18-24 Year Olds |
| Sierra Leoneans | 98.7 /100 | #96 | Exceptional 19.0% |
| Salvadorans | 98.4 /100 | #97 | Exceptional 19.1% |
| Immigrants | Jordan | 98.4 /100 | #98 | Exceptional 19.1% |
| Immigrants | Czechoslovakia | 98.3 /100 | #99 | Exceptional 19.1% |
| Chileans | 98.3 /100 | #100 | Exceptional 19.1% |
| Ecuadorians | 98.1 /100 | #101 | Exceptional 19.1% |
| Immigrants | Caribbean | 98.1 /100 | #102 | Exceptional 19.1% |
| Serbians | 98.0 /100 | #103 | Exceptional 19.1% |
| Immigrants | Afghanistan | 98.0 /100 | #104 | Exceptional 19.1% |
| Immigrants | Ecuador | 97.8 /100 | #105 | Exceptional 19.2% |
| Immigrants | Sierra Leone | 97.8 /100 | #106 | Exceptional 19.2% |
| Immigrants | Sri Lanka | 97.5 /100 | #107 | Exceptional 19.2% |
| Immigrants | Uzbekistan | 97.3 /100 | #108 | Exceptional 19.2% |
| Immigrants | Syria | 97.2 /100 | #109 | Exceptional 19.2% |
| Laotians | 97.1 /100 | #110 | Exceptional 19.2% |
Demographics Similar to Sioux by Female Poverty Among 18-24 Year Olds
In terms of female poverty among 18-24 year olds, the demographic groups most similar to Sioux are Pima (28.4%, a difference of 0.55%), Hopi (28.2%, a difference of 1.3%), Cheyenne (28.1%, a difference of 1.5%), Colville (29.0%, a difference of 1.6%), and Kiowa (29.2%, a difference of 2.3%).
| Demographics | Rating | Rank | Female Poverty Among 18-24 Year Olds |
| Apache | 0.0 /100 | #333 | Tragic 26.3% |
| Pueblo | 0.0 /100 | #334 | Tragic 26.9% |
| Yup'ik | 0.0 /100 | #335 | Tragic 27.0% |
| Immigrants | Yemen | 0.0 /100 | #336 | Tragic 27.5% |
| Cheyenne | 0.0 /100 | #337 | Tragic 28.1% |
| Hopi | 0.0 /100 | #338 | Tragic 28.2% |
| Pima | 0.0 /100 | #339 | Tragic 28.4% |
| Sioux | 0.0 /100 | #340 | Tragic 28.6% |
| Colville | 0.0 /100 | #341 | Tragic 29.0% |
| Kiowa | 0.0 /100 | #342 | Tragic 29.2% |
| Puerto Ricans | 0.0 /100 | #343 | Tragic 29.8% |
| Navajo | 0.0 /100 | #344 | Tragic 30.3% |
| Tohono O'odham | 0.0 /100 | #345 | Tragic 31.0% |
| Lumbee | 0.0 /100 | #346 | Tragic 31.1% |
| Crow | 0.0 /100 | #347 | Tragic 33.2% |