Immigrants from Costa Rica vs Nigerian 7th Grade
COMPARE
Immigrants from Costa Rica
Nigerian
7th Grade
7th Grade Comparison
Immigrants from Costa Rica
Nigerians
95.3%
7TH GRADE
0.6/ 100
METRIC RATING
259th/ 347
METRIC RANK
95.5%
7TH GRADE
3.0/ 100
METRIC RATING
234th/ 347
METRIC RANK
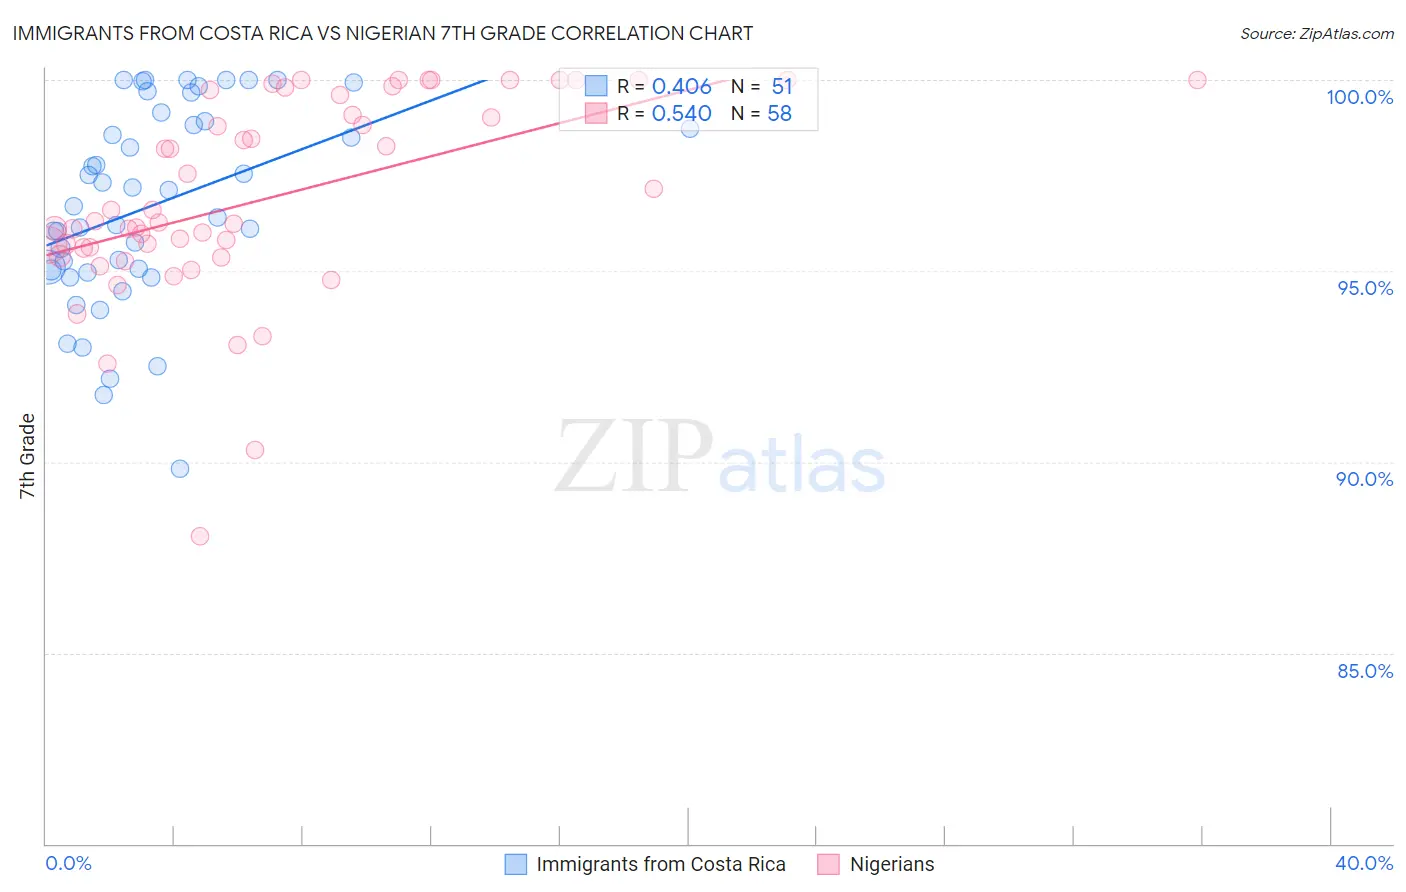
Immigrants from Costa Rica vs Nigerian 7th Grade Correlation Chart
The statistical analysis conducted on geographies consisting of 204,272,182 people shows a moderate positive correlation between the proportion of Immigrants from Costa Rica and percentage of population with at least 7th grade education in the United States with a correlation coefficient (R) of 0.406 and weighted average of 95.3%. Similarly, the statistical analysis conducted on geographies consisting of 332,724,627 people shows a substantial positive correlation between the proportion of Nigerians and percentage of population with at least 7th grade education in the United States with a correlation coefficient (R) of 0.540 and weighted average of 95.5%, a difference of 0.25%.
7th Grade Correlation Summary
| Measurement | Immigrants from Costa Rica | Nigerian |
| Minimum | 89.8% | 88.0% |
| Maximum | 100.0% | 100.0% |
| Range | 10.2% | 12.0% |
| Mean | 96.7% | 96.9% |
| Median | 96.7% | 96.3% |
| Interquartile 25% (IQ1) | 95.0% | 95.6% |
| Interquartile 75% (IQ3) | 98.9% | 99.6% |
| Interquartile Range (IQR) | 3.9% | 4.0% |
| Standard Deviation (Sample) | 2.6% | 2.6% |
| Standard Deviation (Population) | 2.5% | 2.6% |
Similar Demographics by 7th Grade
Demographics Similar to Immigrants from Costa Rica by 7th Grade
In terms of 7th grade, the demographic groups most similar to Immigrants from Costa Rica are Immigrants from China (95.3%, a difference of 0.030%), Immigrants from Congo (95.3%, a difference of 0.030%), Ghanaian (95.3%, a difference of 0.030%), Afghan (95.3%, a difference of 0.030%), and Korean (95.3%, a difference of 0.040%).
| Demographics | Rating | Rank | 7th Grade |
| Immigrants | Ethiopia | 0.9 /100 | #252 | Tragic 95.3% |
| Somalis | 0.9 /100 | #253 | Tragic 95.3% |
| Colombians | 0.8 /100 | #254 | Tragic 95.3% |
| Koreans | 0.8 /100 | #255 | Tragic 95.3% |
| Immigrants | China | 0.7 /100 | #256 | Tragic 95.3% |
| Immigrants | Congo | 0.7 /100 | #257 | Tragic 95.3% |
| Ghanaians | 0.7 /100 | #258 | Tragic 95.3% |
| Immigrants | Costa Rica | 0.6 /100 | #259 | Tragic 95.3% |
| Afghans | 0.5 /100 | #260 | Tragic 95.3% |
| South Americans | 0.5 /100 | #261 | Tragic 95.2% |
| Immigrants | Somalia | 0.5 /100 | #262 | Tragic 95.2% |
| West Indians | 0.5 /100 | #263 | Tragic 95.2% |
| Immigrants | Nigeria | 0.4 /100 | #264 | Tragic 95.2% |
| Immigrants | Uruguay | 0.3 /100 | #265 | Tragic 95.2% |
| Immigrants | Ghana | 0.3 /100 | #266 | Tragic 95.2% |
Demographics Similar to Nigerians by 7th Grade
In terms of 7th grade, the demographic groups most similar to Nigerians are Immigrants from Africa (95.5%, a difference of 0.010%), Costa Rican (95.5%, a difference of 0.020%), Immigrants from Indonesia (95.5%, a difference of 0.020%), Asian (95.5%, a difference of 0.020%), and Immigrants from Asia (95.5%, a difference of 0.040%).
| Demographics | Rating | Rank | 7th Grade |
| Immigrants | Western Asia | 5.4 /100 | #227 | Tragic 95.6% |
| Immigrants | Eastern Africa | 5.1 /100 | #228 | Tragic 95.6% |
| Immigrants | Panama | 4.9 /100 | #229 | Tragic 95.6% |
| Natives/Alaskans | 4.2 /100 | #230 | Tragic 95.6% |
| Senegalese | 4.0 /100 | #231 | Tragic 95.6% |
| Costa Ricans | 3.3 /100 | #232 | Tragic 95.5% |
| Immigrants | Indonesia | 3.3 /100 | #233 | Tragic 95.5% |
| Nigerians | 3.0 /100 | #234 | Tragic 95.5% |
| Immigrants | Africa | 2.7 /100 | #235 | Tragic 95.5% |
| Asians | 2.6 /100 | #236 | Tragic 95.5% |
| Immigrants | Asia | 2.3 /100 | #237 | Tragic 95.5% |
| Indians (Asian) | 2.3 /100 | #238 | Tragic 95.5% |
| Jamaicans | 2.2 /100 | #239 | Tragic 95.5% |
| Immigrants | Sierra Leone | 2.0 /100 | #240 | Tragic 95.5% |
| South American Indians | 2.0 /100 | #241 | Tragic 95.5% |