Serbian vs African 7th Grade
COMPARE
Serbian
African
7th Grade
7th Grade Comparison
Serbians
Africans
97.0%
7TH GRADE
99.8/ 100
METRIC RATING
56th/ 347
METRIC RANK
95.8%
7TH GRADE
17.6/ 100
METRIC RATING
206th/ 347
METRIC RANK
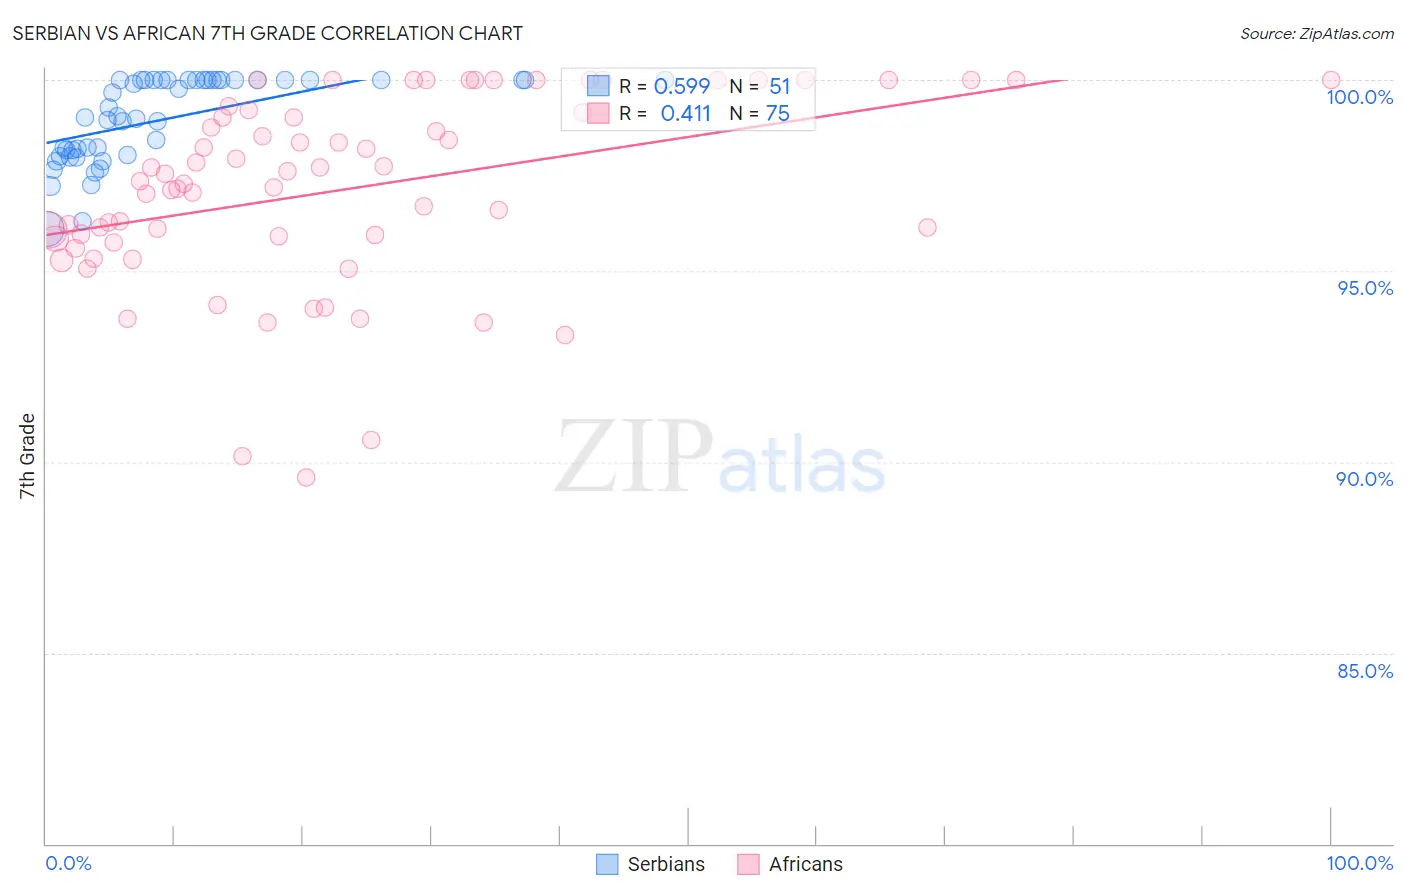
Serbian vs African 7th Grade Correlation Chart
The statistical analysis conducted on geographies consisting of 267,642,942 people shows a substantial positive correlation between the proportion of Serbians and percentage of population with at least 7th grade education in the United States with a correlation coefficient (R) of 0.599 and weighted average of 97.0%. Similarly, the statistical analysis conducted on geographies consisting of 470,094,744 people shows a moderate positive correlation between the proportion of Africans and percentage of population with at least 7th grade education in the United States with a correlation coefficient (R) of 0.411 and weighted average of 95.8%, a difference of 1.2%.
7th Grade Correlation Summary
| Measurement | Serbian | African |
| Minimum | 96.1% | 89.6% |
| Maximum | 100.0% | 100.0% |
| Range | 3.9% | 10.4% |
| Mean | 99.0% | 97.1% |
| Median | 99.1% | 97.3% |
| Interquartile 25% (IQ1) | 98.0% | 95.9% |
| Interquartile 75% (IQ3) | 100.0% | 99.2% |
| Interquartile Range (IQR) | 2.0% | 3.4% |
| Standard Deviation (Sample) | 1.1% | 2.5% |
| Standard Deviation (Population) | 1.1% | 2.5% |
Similar Demographics by 7th Grade
Demographics Similar to Serbians by 7th Grade
In terms of 7th grade, the demographic groups most similar to Serbians are Russian (97.0%, a difference of 0.0%), American (97.0%, a difference of 0.0%), Australian (97.0%, a difference of 0.010%), White/Caucasian (97.0%, a difference of 0.020%), and Macedonian (97.0%, a difference of 0.020%).
| Demographics | Rating | Rank | 7th Grade |
| Slavs | 99.9 /100 | #49 | Exceptional 97.1% |
| Immigrants | Scotland | 99.9 /100 | #50 | Exceptional 97.1% |
| Estonians | 99.9 /100 | #51 | Exceptional 97.0% |
| Greeks | 99.9 /100 | #52 | Exceptional 97.0% |
| Austrians | 99.8 /100 | #53 | Exceptional 97.0% |
| Australians | 99.8 /100 | #54 | Exceptional 97.0% |
| Russians | 99.8 /100 | #55 | Exceptional 97.0% |
| Serbians | 99.8 /100 | #56 | Exceptional 97.0% |
| Americans | 99.8 /100 | #57 | Exceptional 97.0% |
| Whites/Caucasians | 99.8 /100 | #58 | Exceptional 97.0% |
| Macedonians | 99.8 /100 | #59 | Exceptional 97.0% |
| Immigrants | Canada | 99.8 /100 | #60 | Exceptional 96.9% |
| Creek | 99.8 /100 | #61 | Exceptional 96.9% |
| Immigrants | North America | 99.8 /100 | #62 | Exceptional 96.9% |
| Immigrants | Northern Europe | 99.7 /100 | #63 | Exceptional 96.9% |
Demographics Similar to Africans by 7th Grade
In terms of 7th grade, the demographic groups most similar to Africans are Moroccan (95.8%, a difference of 0.010%), Navajo (95.8%, a difference of 0.010%), Immigrants from Sudan (95.8%, a difference of 0.010%), Dutch West Indian (95.8%, a difference of 0.020%), and Hawaiian (95.8%, a difference of 0.020%).
| Demographics | Rating | Rank | 7th Grade |
| Guamanians/Chamorros | 23.5 /100 | #199 | Fair 95.9% |
| Argentineans | 23.2 /100 | #200 | Fair 95.9% |
| Immigrants | Argentina | 21.9 /100 | #201 | Fair 95.9% |
| Immigrants | Northern Africa | 21.4 /100 | #202 | Fair 95.8% |
| Comanche | 21.1 /100 | #203 | Fair 95.8% |
| Assyrians/Chaldeans/Syriacs | 20.5 /100 | #204 | Fair 95.8% |
| Moroccans | 18.9 /100 | #205 | Poor 95.8% |
| Africans | 17.6 /100 | #206 | Poor 95.8% |
| Navajo | 17.0 /100 | #207 | Poor 95.8% |
| Immigrants | Sudan | 17.0 /100 | #208 | Poor 95.8% |
| Dutch West Indians | 16.1 /100 | #209 | Poor 95.8% |
| Hawaiians | 16.0 /100 | #210 | Poor 95.8% |
| Portuguese | 13.6 /100 | #211 | Poor 95.8% |
| Immigrants | Lebanon | 13.0 /100 | #212 | Poor 95.8% |
| Immigrants | Morocco | 12.6 /100 | #213 | Poor 95.8% |