Serbian vs Immigrants from Oceania 3rd Grade
COMPARE
Serbian
Immigrants from Oceania
3rd Grade
3rd Grade Comparison
Serbians
Immigrants from Oceania
98.2%
3RD GRADE
99.6/ 100
METRIC RATING
66th/ 347
METRIC RANK
97.6%
3RD GRADE
9.5/ 100
METRIC RATING
210th/ 347
METRIC RANK
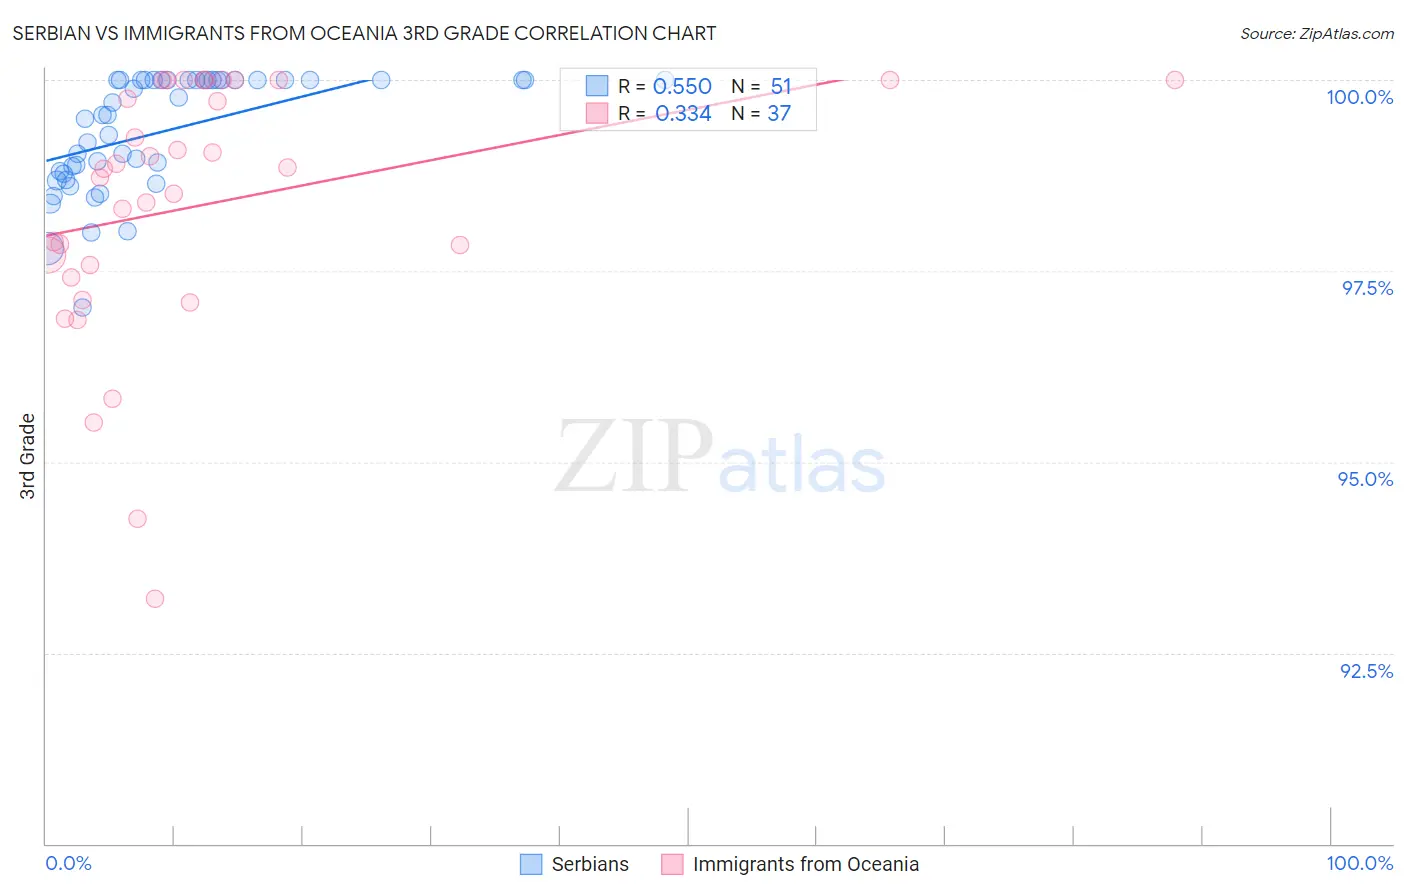
Serbian vs Immigrants from Oceania 3rd Grade Correlation Chart
The statistical analysis conducted on geographies consisting of 267,642,942 people shows a substantial positive correlation between the proportion of Serbians and percentage of population with at least 3rd grade education in the United States with a correlation coefficient (R) of 0.550 and weighted average of 98.2%. Similarly, the statistical analysis conducted on geographies consisting of 305,521,521 people shows a mild positive correlation between the proportion of Immigrants from Oceania and percentage of population with at least 3rd grade education in the United States with a correlation coefficient (R) of 0.334 and weighted average of 97.6%, a difference of 0.66%.
3rd Grade Correlation Summary
| Measurement | Serbian | Immigrants from Oceania |
| Minimum | 97.0% | 93.2% |
| Maximum | 100.0% | 100.0% |
| Range | 3.0% | 6.8% |
| Mean | 99.3% | 98.4% |
| Median | 99.5% | 98.8% |
| Interquartile 25% (IQ1) | 98.8% | 97.5% |
| Interquartile 75% (IQ3) | 100.0% | 100.0% |
| Interquartile Range (IQR) | 1.2% | 2.5% |
| Standard Deviation (Sample) | 0.75% | 1.7% |
| Standard Deviation (Population) | 0.75% | 1.7% |
Similar Demographics by 3rd Grade
Demographics Similar to Serbians by 3rd Grade
In terms of 3rd grade, the demographic groups most similar to Serbians are New Zealander (98.2%, a difference of 0.0%), Russian (98.2%, a difference of 0.0%), Immigrants from Northern Europe (98.2%, a difference of 0.0%), Canadian (98.2%, a difference of 0.0%), and Kiowa (98.2%, a difference of 0.010%).
| Demographics | Rating | Rank | 3rd Grade |
| Maltese | 99.7 /100 | #59 | Exceptional 98.3% |
| Creek | 99.7 /100 | #60 | Exceptional 98.2% |
| Pueblo | 99.7 /100 | #61 | Exceptional 98.2% |
| Immigrants | Canada | 99.7 /100 | #62 | Exceptional 98.2% |
| Immigrants | North America | 99.7 /100 | #63 | Exceptional 98.2% |
| Kiowa | 99.6 /100 | #64 | Exceptional 98.2% |
| New Zealanders | 99.6 /100 | #65 | Exceptional 98.2% |
| Serbians | 99.6 /100 | #66 | Exceptional 98.2% |
| Russians | 99.6 /100 | #67 | Exceptional 98.2% |
| Immigrants | Northern Europe | 99.6 /100 | #68 | Exceptional 98.2% |
| Canadians | 99.6 /100 | #69 | Exceptional 98.2% |
| Cajuns | 99.6 /100 | #70 | Exceptional 98.2% |
| Immigrants | Austria | 99.6 /100 | #71 | Exceptional 98.2% |
| Chickasaw | 99.5 /100 | #72 | Exceptional 98.2% |
| Cheyenne | 99.3 /100 | #73 | Exceptional 98.2% |
Demographics Similar to Immigrants from Oceania by 3rd Grade
In terms of 3rd grade, the demographic groups most similar to Immigrants from Oceania are Costa Rican (97.6%, a difference of 0.0%), Laotian (97.6%, a difference of 0.0%), Immigrants from Bahamas (97.6%, a difference of 0.010%), Moroccan (97.6%, a difference of 0.010%), and Yuman (97.6%, a difference of 0.010%).
| Demographics | Rating | Rank | 3rd Grade |
| Paiute | 16.7 /100 | #203 | Poor 97.6% |
| Immigrants | Chile | 16.5 /100 | #204 | Poor 97.6% |
| Africans | 14.5 /100 | #205 | Poor 97.6% |
| Immigrants | Northern Africa | 13.0 /100 | #206 | Poor 97.6% |
| Tohono O'odham | 12.5 /100 | #207 | Poor 97.6% |
| Immigrants | Zaire | 11.9 /100 | #208 | Poor 97.6% |
| Costa Ricans | 9.6 /100 | #209 | Tragic 97.6% |
| Immigrants | Oceania | 9.5 /100 | #210 | Tragic 97.6% |
| Laotians | 9.4 /100 | #211 | Tragic 97.6% |
| Immigrants | Bahamas | 8.5 /100 | #212 | Tragic 97.6% |
| Moroccans | 8.5 /100 | #213 | Tragic 97.6% |
| Yuman | 8.4 /100 | #214 | Tragic 97.6% |
| Iraqis | 6.9 /100 | #215 | Tragic 97.5% |
| Samoans | 6.9 /100 | #216 | Tragic 97.5% |
| South American Indians | 5.7 /100 | #217 | Tragic 97.5% |