Guyanese vs Immigrants from Oceania 3rd Grade
COMPARE
Guyanese
Immigrants from Oceania
3rd Grade
3rd Grade Comparison
Guyanese
Immigrants from Oceania
96.7%
3RD GRADE
0.0/ 100
METRIC RATING
306th/ 347
METRIC RANK
97.6%
3RD GRADE
9.5/ 100
METRIC RATING
210th/ 347
METRIC RANK
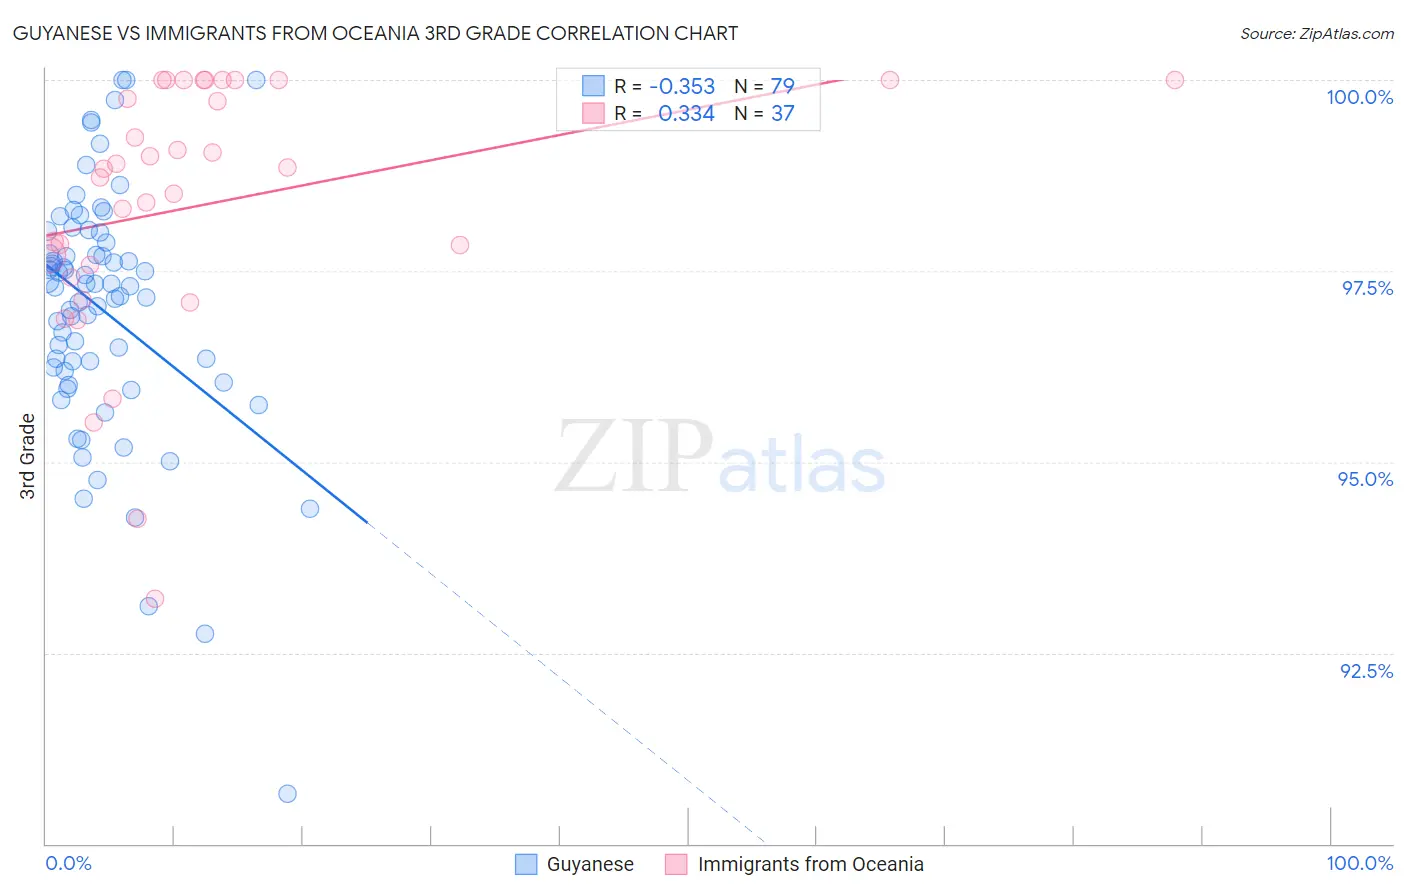
Guyanese vs Immigrants from Oceania 3rd Grade Correlation Chart
The statistical analysis conducted on geographies consisting of 176,921,765 people shows a mild negative correlation between the proportion of Guyanese and percentage of population with at least 3rd grade education in the United States with a correlation coefficient (R) of -0.353 and weighted average of 96.7%. Similarly, the statistical analysis conducted on geographies consisting of 305,521,521 people shows a mild positive correlation between the proportion of Immigrants from Oceania and percentage of population with at least 3rd grade education in the United States with a correlation coefficient (R) of 0.334 and weighted average of 97.6%, a difference of 0.91%.
3rd Grade Correlation Summary
| Measurement | Guyanese | Immigrants from Oceania |
| Minimum | 90.7% | 93.2% |
| Maximum | 100.0% | 100.0% |
| Range | 9.3% | 6.8% |
| Mean | 97.0% | 98.4% |
| Median | 97.3% | 98.8% |
| Interquartile 25% (IQ1) | 96.2% | 97.5% |
| Interquartile 75% (IQ3) | 97.9% | 100.0% |
| Interquartile Range (IQR) | 1.7% | 2.5% |
| Standard Deviation (Sample) | 1.6% | 1.7% |
| Standard Deviation (Population) | 1.6% | 1.7% |
Similar Demographics by 3rd Grade
Demographics Similar to Guyanese by 3rd Grade
In terms of 3rd grade, the demographic groups most similar to Guyanese are Nicaraguan (96.7%, a difference of 0.020%), Immigrants from Haiti (96.7%, a difference of 0.020%), Sri Lankan (96.7%, a difference of 0.020%), Central American Indian (96.7%, a difference of 0.030%), and Immigrants from Caribbean (96.7%, a difference of 0.040%).
| Demographics | Rating | Rank | 3rd Grade |
| Somalis | 0.0 /100 | #299 | Tragic 96.8% |
| Immigrants | South Eastern Asia | 0.0 /100 | #300 | Tragic 96.8% |
| Immigrants | Cuba | 0.0 /100 | #301 | Tragic 96.8% |
| Immigrants | Somalia | 0.0 /100 | #302 | Tragic 96.8% |
| Ecuadorians | 0.0 /100 | #303 | Tragic 96.7% |
| Immigrants | Caribbean | 0.0 /100 | #304 | Tragic 96.7% |
| Central American Indians | 0.0 /100 | #305 | Tragic 96.7% |
| Guyanese | 0.0 /100 | #306 | Tragic 96.7% |
| Nicaraguans | 0.0 /100 | #307 | Tragic 96.7% |
| Immigrants | Haiti | 0.0 /100 | #308 | Tragic 96.7% |
| Sri Lankans | 0.0 /100 | #309 | Tragic 96.7% |
| Cape Verdeans | 0.0 /100 | #310 | Tragic 96.6% |
| Immigrants | Guyana | 0.0 /100 | #311 | Tragic 96.6% |
| Immigrants | Laos | 0.0 /100 | #312 | Tragic 96.6% |
| Immigrants | Ecuador | 0.0 /100 | #313 | Tragic 96.6% |
Demographics Similar to Immigrants from Oceania by 3rd Grade
In terms of 3rd grade, the demographic groups most similar to Immigrants from Oceania are Costa Rican (97.6%, a difference of 0.0%), Laotian (97.6%, a difference of 0.0%), Immigrants from Bahamas (97.6%, a difference of 0.010%), Moroccan (97.6%, a difference of 0.010%), and Yuman (97.6%, a difference of 0.010%).
| Demographics | Rating | Rank | 3rd Grade |
| Paiute | 16.7 /100 | #203 | Poor 97.6% |
| Immigrants | Chile | 16.5 /100 | #204 | Poor 97.6% |
| Africans | 14.5 /100 | #205 | Poor 97.6% |
| Immigrants | Northern Africa | 13.0 /100 | #206 | Poor 97.6% |
| Tohono O'odham | 12.5 /100 | #207 | Poor 97.6% |
| Immigrants | Zaire | 11.9 /100 | #208 | Poor 97.6% |
| Costa Ricans | 9.6 /100 | #209 | Tragic 97.6% |
| Immigrants | Oceania | 9.5 /100 | #210 | Tragic 97.6% |
| Laotians | 9.4 /100 | #211 | Tragic 97.6% |
| Immigrants | Bahamas | 8.5 /100 | #212 | Tragic 97.6% |
| Moroccans | 8.5 /100 | #213 | Tragic 97.6% |
| Yuman | 8.4 /100 | #214 | Tragic 97.6% |
| Iraqis | 6.9 /100 | #215 | Tragic 97.5% |
| Samoans | 6.9 /100 | #216 | Tragic 97.5% |
| South American Indians | 5.7 /100 | #217 | Tragic 97.5% |