Blackfeet vs Immigrants from Oceania 3rd Grade
COMPARE
Blackfeet
Immigrants from Oceania
3rd Grade
3rd Grade Comparison
Blackfeet
Immigrants from Oceania
97.9%
3RD GRADE
86.3/ 100
METRIC RATING
139th/ 347
METRIC RANK
97.6%
3RD GRADE
9.5/ 100
METRIC RATING
210th/ 347
METRIC RANK
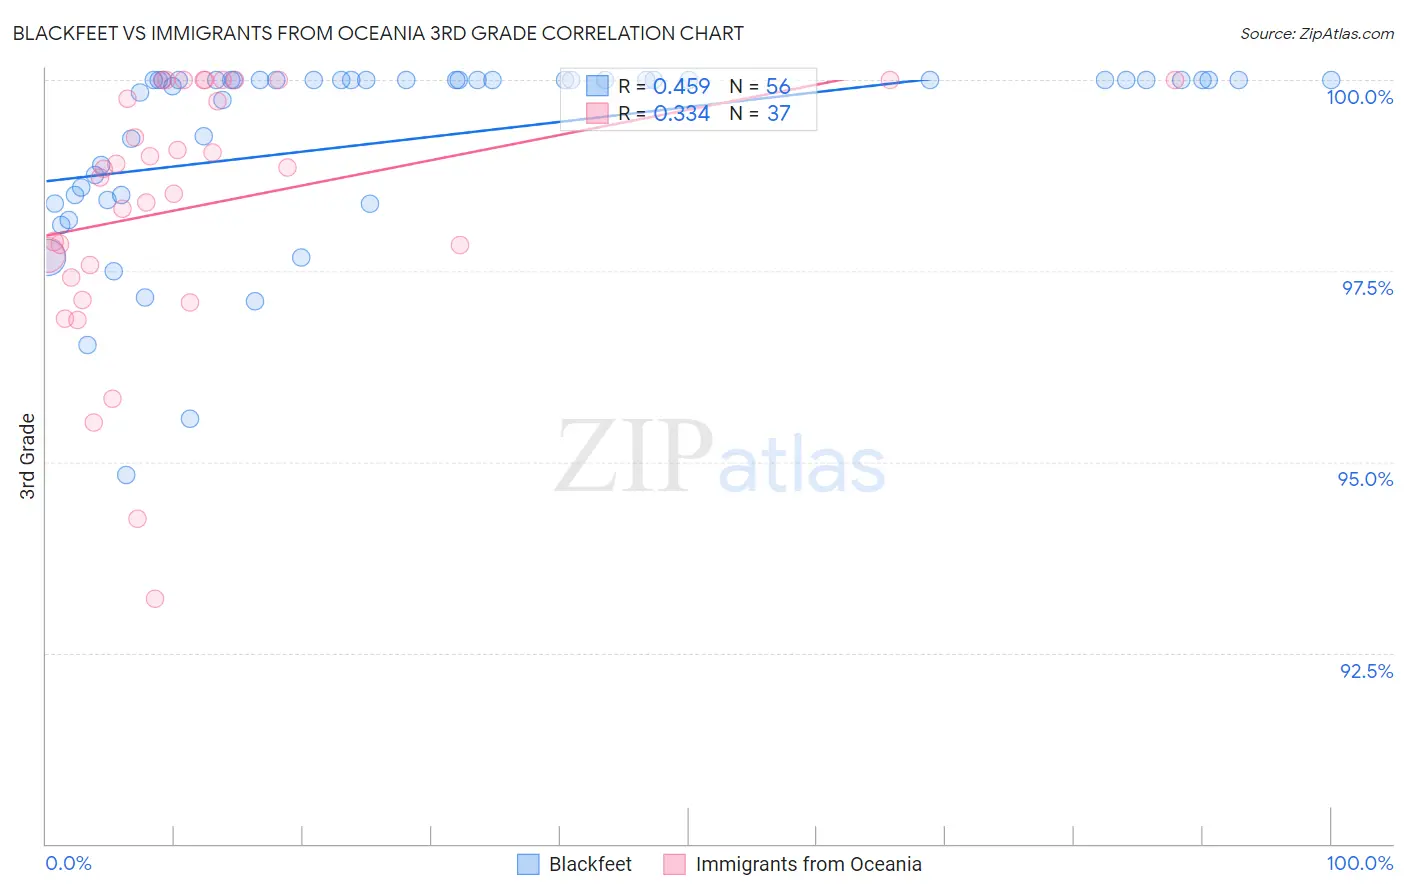
Blackfeet vs Immigrants from Oceania 3rd Grade Correlation Chart
The statistical analysis conducted on geographies consisting of 309,580,957 people shows a moderate positive correlation between the proportion of Blackfeet and percentage of population with at least 3rd grade education in the United States with a correlation coefficient (R) of 0.459 and weighted average of 97.9%. Similarly, the statistical analysis conducted on geographies consisting of 305,521,521 people shows a mild positive correlation between the proportion of Immigrants from Oceania and percentage of population with at least 3rd grade education in the United States with a correlation coefficient (R) of 0.334 and weighted average of 97.6%, a difference of 0.35%.
3rd Grade Correlation Summary
| Measurement | Blackfeet | Immigrants from Oceania |
| Minimum | 94.8% | 93.2% |
| Maximum | 100.0% | 100.0% |
| Range | 5.2% | 6.8% |
| Mean | 99.2% | 98.4% |
| Median | 100.0% | 98.8% |
| Interquartile 25% (IQ1) | 98.5% | 97.5% |
| Interquartile 75% (IQ3) | 100.0% | 100.0% |
| Interquartile Range (IQR) | 1.5% | 2.5% |
| Standard Deviation (Sample) | 1.2% | 1.7% |
| Standard Deviation (Population) | 1.2% | 1.7% |
Similar Demographics by 3rd Grade
Demographics Similar to Blackfeet by 3rd Grade
In terms of 3rd grade, the demographic groups most similar to Blackfeet are Israeli (97.9%, a difference of 0.0%), Cambodian (97.9%, a difference of 0.010%), Spaniard (97.9%, a difference of 0.010%), Immigrants from Romania (97.9%, a difference of 0.010%), and Palestinian (97.9%, a difference of 0.010%).
| Demographics | Rating | Rank | 3rd Grade |
| Immigrants | Hungary | 88.8 /100 | #132 | Excellent 97.9% |
| Immigrants | Kuwait | 88.7 /100 | #133 | Excellent 97.9% |
| Seminole | 88.7 /100 | #134 | Excellent 97.9% |
| Cambodians | 88.1 /100 | #135 | Excellent 97.9% |
| Spaniards | 87.9 /100 | #136 | Excellent 97.9% |
| Immigrants | Romania | 87.9 /100 | #137 | Excellent 97.9% |
| Israelis | 86.6 /100 | #138 | Excellent 97.9% |
| Blackfeet | 86.3 /100 | #139 | Excellent 97.9% |
| Palestinians | 84.6 /100 | #140 | Excellent 97.9% |
| Immigrants | Turkey | 83.5 /100 | #141 | Excellent 97.9% |
| Hmong | 80.3 /100 | #142 | Excellent 97.9% |
| Filipinos | 79.9 /100 | #143 | Good 97.9% |
| Burmese | 79.6 /100 | #144 | Good 97.9% |
| Immigrants | Greece | 79.5 /100 | #145 | Good 97.9% |
| Alsatians | 78.3 /100 | #146 | Good 97.9% |
Demographics Similar to Immigrants from Oceania by 3rd Grade
In terms of 3rd grade, the demographic groups most similar to Immigrants from Oceania are Costa Rican (97.6%, a difference of 0.0%), Laotian (97.6%, a difference of 0.0%), Immigrants from Bahamas (97.6%, a difference of 0.010%), Moroccan (97.6%, a difference of 0.010%), and Yuman (97.6%, a difference of 0.010%).
| Demographics | Rating | Rank | 3rd Grade |
| Paiute | 16.7 /100 | #203 | Poor 97.6% |
| Immigrants | Chile | 16.5 /100 | #204 | Poor 97.6% |
| Africans | 14.5 /100 | #205 | Poor 97.6% |
| Immigrants | Northern Africa | 13.0 /100 | #206 | Poor 97.6% |
| Tohono O'odham | 12.5 /100 | #207 | Poor 97.6% |
| Immigrants | Zaire | 11.9 /100 | #208 | Poor 97.6% |
| Costa Ricans | 9.6 /100 | #209 | Tragic 97.6% |
| Immigrants | Oceania | 9.5 /100 | #210 | Tragic 97.6% |
| Laotians | 9.4 /100 | #211 | Tragic 97.6% |
| Immigrants | Bahamas | 8.5 /100 | #212 | Tragic 97.6% |
| Moroccans | 8.5 /100 | #213 | Tragic 97.6% |
| Yuman | 8.4 /100 | #214 | Tragic 97.6% |
| Iraqis | 6.9 /100 | #215 | Tragic 97.5% |
| Samoans | 6.9 /100 | #216 | Tragic 97.5% |
| South American Indians | 5.7 /100 | #217 | Tragic 97.5% |