Seminole vs Immigrants from South Eastern Asia 6th Grade

COMPARE

Seminole
Race
Ancestry
AfghanAfricanAlaska NativeAlaskan AthabascanAlbanianAleutAlsatianAmericanApacheArabArapahoArgentineanArmenianAssyrian/Chaldean/SyriacAustralianAustrianBahamianBangladeshiBarbadianBasqueBelgianBelizeanBermudanBhutaneseBlackfeetBolivianBrazilianBritishBritish West IndianBulgarianBurmeseCajunCambodianCanadianCape VerdeanCarpatho RusynCelticCentral AmericanCentral American IndianCherokeeCheyenneChickasawChileanChineseChippewaChoctawColombianColvilleComancheCosta RicanCreeCreekCroatianCrowCubanCypriotCzechCzechoslovakianDanishDelawareDominicanDutchDutch West IndianEastern EuropeanEcuadorianEgyptianEnglishEstonianEthiopianEuropeanFijianFilipinoFinnishFrenchFrench American IndianFrench CanadianGermanGerman RussianGhanaianGreekGuamanian/ChamorroGuatemalanGuyaneseHaitianHmongHonduranHopiHoumaHungarianIcelanderIndian (Asian)IndonesianInupiatIranianIraqiIrishIroquoisIsraeliItalianJamaicanJapaneseJordanianKenyanKiowaKoreanLaotianLatvianLebaneseLiberianLithuanianLumbeeLuxembourgerMacedonianMalaysianMalteseMarshalleseMenomineeMexicanMexican American IndianMongolianMoroccanNative HawaiianNavajoNepaleseNew ZealanderNicaraguanNigerianNorthern EuropeanNorwegianOkinawanOsageOttawaPaiutePakistaniPalestinianPanamanianParaguayanPennsylvania GermanPeruvianPimaPolishPortuguesePotawatomiPuebloPuerto RicanPuget Sound SalishRomanianRussianSalvadoranSamoanScandinavianScotch-IrishScottishSeminoleSenegaleseSerbianShoshoneSierra LeoneanSiouxSlavicSlovakSloveneSomaliSouth AfricanSouth AmericanSouth American IndianSoviet UnionSpaniardSpanishSpanish AmericanSpanish American IndianSri LankanSubsaharan AfricanSudaneseSwedishSwissSyrianTaiwaneseThaiTlingit-HaidaTohono O'OdhamTonganTrinidadian and TobagonianTsimshianTurkishU.S. Virgin IslanderUgandanUkrainianUruguayanUteVenezuelanVietnameseWelshWest IndianYakamaYaquiYugoslavianYumanYup'ikZimbabwean
Immigration
NonimmigrantsImmigrantsAfghanistanAfricaAlbaniaArgentinaArmeniaAsiaAustraliaAustriaBahamasBangladeshBarbadosBelarusBelgiumBelizeBoliviaBosnia and HerzegovinaBrazilBulgariaBurma/MyanmarCabo VerdeCambodiaCameroonCanadaCaribbeanCentral AmericaChileChinaColombiaCongoCosta RicaCroatiaCubaCzechoslovakiaDenmarkDominicaDominican RepublicEastern AfricaEastern AsiaEastern EuropeEcuadorEgyptEl SalvadorEnglandEritreaEthiopiaEuropeFijiFranceGermanyGhanaGreeceGrenadaGuatemalaGuyanaHaitiHondurasHong KongHungaryIndiaIndonesiaIranIraqIrelandIsraelItalyJamaicaJapanJordanKazakhstanKenyaKoreaKuwaitLaosLatin AmericaLatviaLebanonLiberiaLithuaniaMalaysiaMexicoMicronesiaMiddle AfricaMoldovaMoroccoNepalNetherlandsNicaraguaNigeriaNorth AmericaNorth MacedoniaNorthern AfricaNorthern EuropeNorwayOceaniaPakistanPanamaPeruPhilippinesPolandPortugalRomaniaRussiaSaudi ArabiaScotlandSenegalSerbiaSierra LeoneSingaporeSomaliaSouth AfricaSouth AmericaSouth Central AsiaSouthern EuropeSpainSri LankaSt. Vincent and the GrenadinesSudanSwedenSwitzerlandSyriaTaiwanThailandTrinidad and TobagoTurkeyUgandaUkraineUruguayUzbekistanVenezuelaVietnamWest IndiesWestern AfricaWestern AsiaWestern EuropeYemenZaireZimbabweAzores
Immigrants from South Eastern Asia
Race
Ancestry
AfghanAfricanAlaska NativeAlaskan AthabascanAlbanianAleutAlsatianAmericanApacheArabArapahoArgentineanArmenianAssyrian/Chaldean/SyriacAustralianAustrianBahamianBangladeshiBarbadianBasqueBelgianBelizeanBermudanBhutaneseBlackfeetBolivianBrazilianBritishBritish West IndianBulgarianBurmeseCajunCambodianCanadianCape VerdeanCarpatho RusynCelticCentral AmericanCentral American IndianCherokeeCheyenneChickasawChileanChineseChippewaChoctawColombianColvilleComancheCosta RicanCreeCreekCroatianCrowCubanCypriotCzechCzechoslovakianDanishDelawareDominicanDutchDutch West IndianEastern EuropeanEcuadorianEgyptianEnglishEstonianEthiopianEuropeanFijianFilipinoFinnishFrenchFrench American IndianFrench CanadianGermanGerman RussianGhanaianGreekGuamanian/ChamorroGuatemalanGuyaneseHaitianHmongHonduranHopiHoumaHungarianIcelanderIndian (Asian)IndonesianInupiatIranianIraqiIrishIroquoisIsraeliItalianJamaicanJapaneseJordanianKenyanKiowaKoreanLaotianLatvianLebaneseLiberianLithuanianLumbeeLuxembourgerMacedonianMalaysianMalteseMarshalleseMenomineeMexicanMexican American IndianMongolianMoroccanNative HawaiianNavajoNepaleseNew ZealanderNicaraguanNigerianNorthern EuropeanNorwegianOkinawanOsageOttawaPaiutePakistaniPalestinianPanamanianParaguayanPennsylvania GermanPeruvianPimaPolishPortuguesePotawatomiPuebloPuerto RicanPuget Sound SalishRomanianRussianSalvadoranSamoanScandinavianScotch-IrishScottishSenegaleseSerbianShoshoneSierra LeoneanSiouxSlavicSlovakSloveneSomaliSouth AfricanSouth AmericanSouth American IndianSoviet UnionSpaniardSpanishSpanish AmericanSpanish American IndianSri LankanSubsaharan AfricanSudaneseSwedishSwissSyrianTaiwaneseThaiTlingit-HaidaTohono O'OdhamTonganTrinidadian and TobagonianTsimshianTurkishU.S. Virgin IslanderUgandanUkrainianUruguayanUteVenezuelanVietnameseWelshWest IndianYakamaYaquiYugoslavianYumanYup'ikZimbabwean
Immigration
NonimmigrantsImmigrantsAfghanistanAfricaAlbaniaArgentinaArmeniaAsiaAustraliaAustriaBahamasBangladeshBarbadosBelarusBelgiumBelizeBoliviaBosnia and HerzegovinaBrazilBulgariaBurma/MyanmarCabo VerdeCambodiaCameroonCanadaCaribbeanCentral AmericaChileChinaColombiaCongoCosta RicaCroatiaCubaCzechoslovakiaDenmarkDominicaDominican RepublicEastern AfricaEastern AsiaEastern EuropeEcuadorEgyptEl SalvadorEnglandEritreaEthiopiaEuropeFijiFranceGermanyGhanaGreeceGrenadaGuatemalaGuyanaHaitiHondurasHong KongHungaryIndiaIndonesiaIranIraqIrelandIsraelItalyJamaicaJapanJordanKazakhstanKenyaKoreaKuwaitLaosLatin AmericaLatviaLebanonLiberiaLithuaniaMalaysiaMexicoMicronesiaMiddle AfricaMoldovaMoroccoNepalNetherlandsNicaraguaNigeriaNorth AmericaNorth MacedoniaNorthern AfricaNorthern EuropeNorwayOceaniaPakistanPanamaPeruPhilippinesPolandPortugalRomaniaRussiaSaudi ArabiaScotlandSenegalSerbiaSierra LeoneSingaporeSomaliaSouth AfricaSouth AmericaSouth Central AsiaSouth Eastern AsiaSouthern EuropeSpainSri LankaSt. Vincent and the GrenadinesSudanSwedenSwitzerlandSyriaTaiwanThailandTrinidad and TobagoTurkeyUgandaUkraineUruguayUzbekistanVenezuelaVietnamWest IndiesWestern AfricaWestern AsiaWestern EuropeYemenZaireZimbabweAzores
6th Grade
Income
Poverty
Unemployment
Labor Participation
Family Structure
Vehicle Availability
Education Level
Disability

6th Grade Comparison

Seminole

Immigrants from South Eastern Asia

Excellent
Tragic
97.2%
6TH GRADE
84.8/ 100
METRIC RATING
141st/ 347
METRIC RANK
95.9%
6TH GRADE
0.0/ 100
METRIC RATING
296th/ 347
METRIC RANK

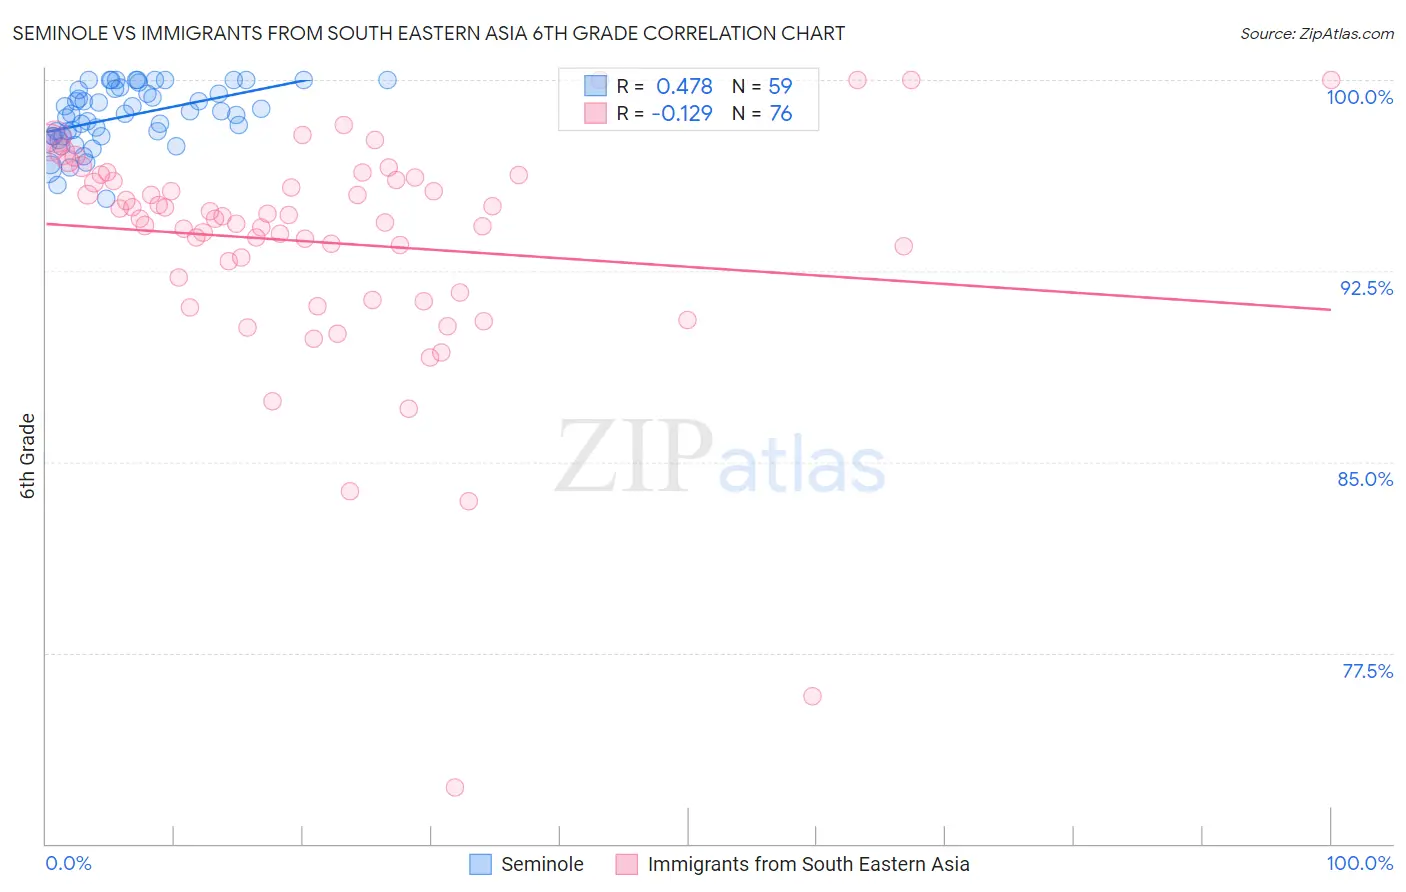
Seminole vs Immigrants from South Eastern Asia 6th Grade Correlation Chart

The statistical analysis conducted on geographies consisting of 118,313,204 people shows a moderate positive correlation between the proportion of Seminole and percentage of population with at least 6th grade education in the United States with a correlation coefficient (R) of 0.478 and weighted average of 97.2%. Similarly, the statistical analysis conducted on geographies consisting of 512,710,223 people shows a poor negative correlation between the proportion of Immigrants from South Eastern Asia and percentage of population with at least 6th grade education in the United States with a correlation coefficient (R) of -0.129 and weighted average of 95.9%, a difference of 1.4%.
Seminole vs Immigrants from South Eastern Asia 6th Grade

6th Grade Correlation Summary

MeasurementSeminoleImmigrants from South Eastern Asia
Minimum95.3%72.2%
Maximum100.0%100.0%
Range4.7%27.8%
Mean98.6%93.6%
Median98.7%94.6%
Interquartile 25% (IQ1)97.8%91.9%
Interquartile 75% (IQ3)99.6%96.1%
Interquartile Range (IQR)1.9%4.2%
Standard Deviation (Sample)1.2%4.6%
Standard Deviation (Population)1.2%4.6%

Similar Demographics by 6th Grade

Demographics Similar to Seminole by 6th Grade

In terms of 6th grade, the demographic groups most similar to Seminole are Jordanian (97.2%, a difference of 0.0%), Immigrants from Turkey (97.3%, a difference of 0.010%), Immigrants from North Macedonia (97.2%, a difference of 0.010%), Pima (97.2%, a difference of 0.020%), and Israeli (97.2%, a difference of 0.020%).
DemographicsRating | Rank6th Grade
Immigrants | Kuwait
89.5
/100
|
#134
Excellent
97.3%
Immigrants | Hungary
89.5
/100
|
#135
Excellent
97.3%
Filipinos
88.9
/100
|
#136
Excellent
97.3%
Burmese
87.8
/100
|
#137
Excellent
97.3%
Blackfeet
87.7
/100
|
#138
Excellent
97.3%
Immigrants | Turkey
86.1
/100
|
#139
Excellent
97.3%
Immigrants | North Macedonia
85.5
/100
|
#140
Excellent
97.2%
Seminole
84.8
/100
|
#141
Excellent
97.2%
Jordanians
84.6
/100
|
#142
Excellent
97.2%
Pima
82.9
/100
|
#143
Excellent
97.2%
Israelis
82.9
/100
|
#144
Excellent
97.2%
Spaniards
80.1
/100
|
#145
Excellent
97.2%
Hopi
78.8
/100
|
#146
Good
97.2%
Immigrants | South Central Asia
78.1
/100
|
#147
Good
97.2%
Immigrants | Greece
77.8
/100
|
#148
Good
97.2%

Demographics Similar to Immigrants from South Eastern Asia by 6th Grade

In terms of 6th grade, the demographic groups most similar to Immigrants from South Eastern Asia are Immigrants from Grenada (95.9%, a difference of 0.010%), British West Indian (96.0%, a difference of 0.070%), Haitian (95.8%, a difference of 0.11%), Immigrants from West Indies (96.1%, a difference of 0.14%), and Immigrants from Barbados (96.1%, a difference of 0.18%).
DemographicsRating | Rank6th Grade
Immigrants | Eritrea
0.0
/100
|
#289
Tragic
96.1%
Immigrants | Somalia
0.0
/100
|
#290
Tragic
96.1%
Immigrants | St. Vincent and the Grenadines
0.0
/100
|
#291
Tragic
96.1%
Immigrants | Barbados
0.0
/100
|
#292
Tragic
96.1%
Immigrants | West Indies
0.0
/100
|
#293
Tragic
96.1%
British West Indians
0.0
/100
|
#294
Tragic
96.0%
Immigrants | Grenada
0.0
/100
|
#295
Tragic
95.9%
Immigrants | South Eastern Asia
0.0
/100
|
#296
Tragic
95.9%
Haitians
0.0
/100
|
#297
Tragic
95.8%
Sri Lankans
0.0
/100
|
#298
Tragic
95.8%
Immigrants | Laos
0.0
/100
|
#299
Tragic
95.7%
Immigrants | Dominica
0.0
/100
|
#300
Tragic
95.7%
Immigrants | Immigrants
0.0
/100
|
#301
Tragic
95.7%
Immigrants | Burma/Myanmar
0.0
/100
|
#302
Tragic
95.7%
Bangladeshis
0.0
/100
|
#303
Tragic
95.7%