French Canadian vs Immigrants from South Eastern Asia 6th Grade
COMPARE
French Canadian
Immigrants from South Eastern Asia
6th Grade
6th Grade Comparison
French Canadians
Immigrants from South Eastern Asia
98.0%
6TH GRADE
100.0/ 100
METRIC RATING
30th/ 347
METRIC RANK
95.9%
6TH GRADE
0.0/ 100
METRIC RATING
296th/ 347
METRIC RANK
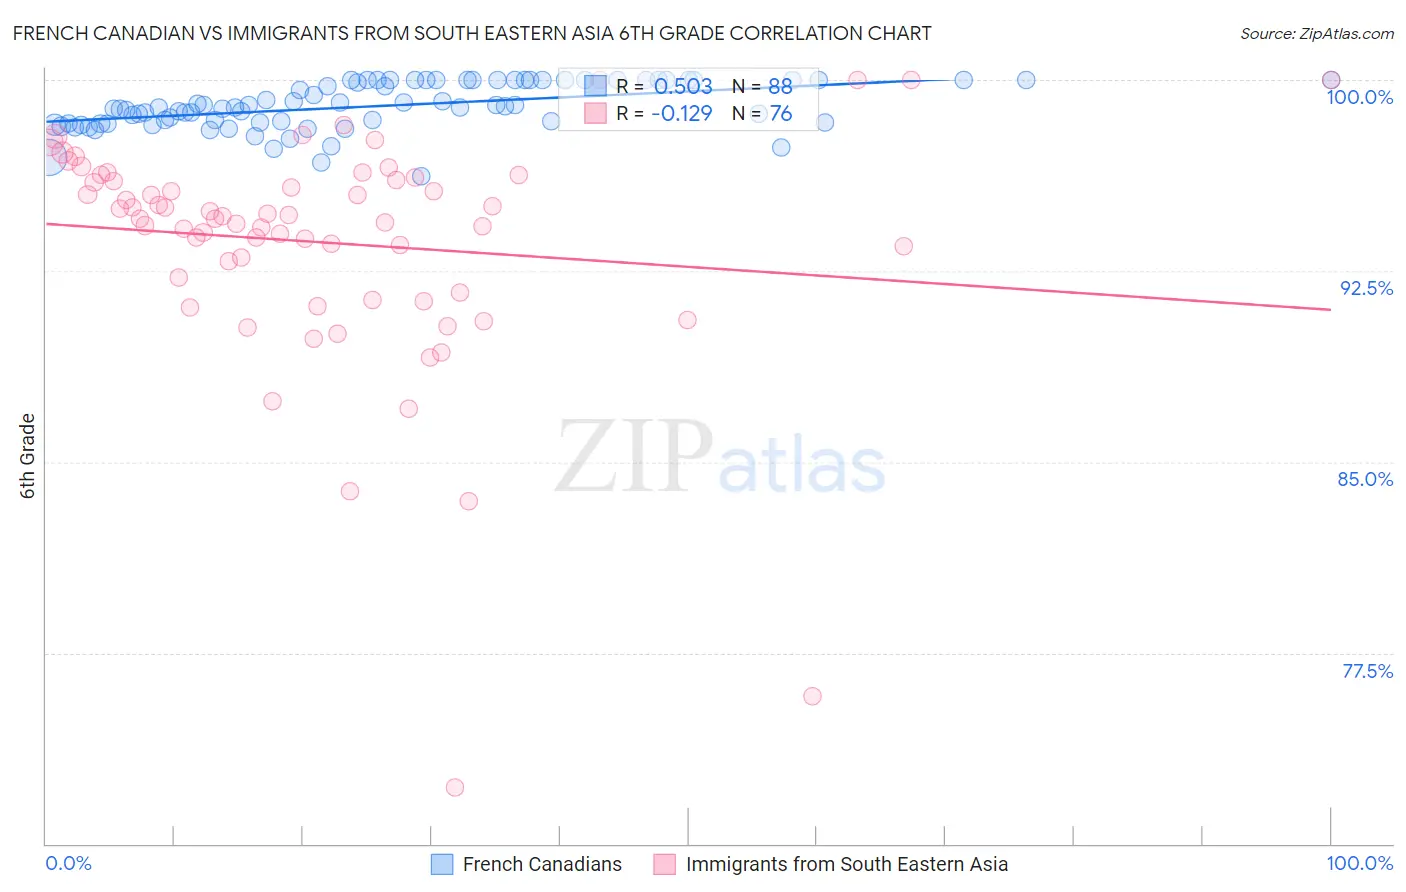
French Canadian vs Immigrants from South Eastern Asia 6th Grade Correlation Chart
The statistical analysis conducted on geographies consisting of 502,679,457 people shows a substantial positive correlation between the proportion of French Canadians and percentage of population with at least 6th grade education in the United States with a correlation coefficient (R) of 0.503 and weighted average of 98.0%. Similarly, the statistical analysis conducted on geographies consisting of 512,710,223 people shows a poor negative correlation between the proportion of Immigrants from South Eastern Asia and percentage of population with at least 6th grade education in the United States with a correlation coefficient (R) of -0.129 and weighted average of 95.9%, a difference of 2.1%.
6th Grade Correlation Summary
| Measurement | French Canadian | Immigrants from South Eastern Asia |
| Minimum | 96.2% | 72.2% |
| Maximum | 100.0% | 100.0% |
| Range | 3.8% | 27.8% |
| Mean | 99.0% | 93.6% |
| Median | 98.9% | 94.6% |
| Interquartile 25% (IQ1) | 98.3% | 91.9% |
| Interquartile 75% (IQ3) | 100.0% | 96.1% |
| Interquartile Range (IQR) | 1.7% | 4.2% |
| Standard Deviation (Sample) | 0.90% | 4.6% |
| Standard Deviation (Population) | 0.90% | 4.6% |
Similar Demographics by 6th Grade
Demographics Similar to French Canadians by 6th Grade
In terms of 6th grade, the demographic groups most similar to French Canadians are European (98.0%, a difference of 0.0%), Yup'ik (98.0%, a difference of 0.010%), Scandinavian (98.0%, a difference of 0.010%), French (98.0%, a difference of 0.010%), and Alaska Native (98.0%, a difference of 0.010%).
| Demographics | Rating | Rank | 6th Grade |
| Sioux | 100.0 /100 | #23 | Exceptional 98.0% |
| Croatians | 100.0 /100 | #24 | Exceptional 98.0% |
| Scotch-Irish | 100.0 /100 | #25 | Exceptional 98.0% |
| Czechs | 100.0 /100 | #26 | Exceptional 98.0% |
| Yup'ik | 100.0 /100 | #27 | Exceptional 98.0% |
| Scandinavians | 100.0 /100 | #28 | Exceptional 98.0% |
| French | 100.0 /100 | #29 | Exceptional 98.0% |
| French Canadians | 100.0 /100 | #30 | Exceptional 98.0% |
| Europeans | 100.0 /100 | #31 | Exceptional 98.0% |
| Alaska Natives | 100.0 /100 | #32 | Exceptional 98.0% |
| Chippewa | 100.0 /100 | #33 | Exceptional 97.9% |
| Swiss | 100.0 /100 | #34 | Exceptional 97.9% |
| Chinese | 100.0 /100 | #35 | Exceptional 97.9% |
| Italians | 100.0 /100 | #36 | Exceptional 97.9% |
| British | 100.0 /100 | #37 | Exceptional 97.9% |
Demographics Similar to Immigrants from South Eastern Asia by 6th Grade
In terms of 6th grade, the demographic groups most similar to Immigrants from South Eastern Asia are Immigrants from Grenada (95.9%, a difference of 0.010%), British West Indian (96.0%, a difference of 0.070%), Haitian (95.8%, a difference of 0.11%), Immigrants from West Indies (96.1%, a difference of 0.14%), and Immigrants from Barbados (96.1%, a difference of 0.18%).
| Demographics | Rating | Rank | 6th Grade |
| Immigrants | Eritrea | 0.0 /100 | #289 | Tragic 96.1% |
| Immigrants | Somalia | 0.0 /100 | #290 | Tragic 96.1% |
| Immigrants | St. Vincent and the Grenadines | 0.0 /100 | #291 | Tragic 96.1% |
| Immigrants | Barbados | 0.0 /100 | #292 | Tragic 96.1% |
| Immigrants | West Indies | 0.0 /100 | #293 | Tragic 96.1% |
| British West Indians | 0.0 /100 | #294 | Tragic 96.0% |
| Immigrants | Grenada | 0.0 /100 | #295 | Tragic 95.9% |
| Immigrants | South Eastern Asia | 0.0 /100 | #296 | Tragic 95.9% |
| Haitians | 0.0 /100 | #297 | Tragic 95.8% |
| Sri Lankans | 0.0 /100 | #298 | Tragic 95.8% |
| Immigrants | Laos | 0.0 /100 | #299 | Tragic 95.7% |
| Immigrants | Dominica | 0.0 /100 | #300 | Tragic 95.7% |
| Immigrants | Immigrants | 0.0 /100 | #301 | Tragic 95.7% |
| Immigrants | Burma/Myanmar | 0.0 /100 | #302 | Tragic 95.7% |
| Bangladeshis | 0.0 /100 | #303 | Tragic 95.7% |