Mexican vs Immigrants from South Eastern Asia 6th Grade
COMPARE
Mexican
Immigrants from South Eastern Asia
6th Grade
6th Grade Comparison
Mexicans
Immigrants from South Eastern Asia
94.6%
6TH GRADE
0.0/ 100
METRIC RATING
335th/ 347
METRIC RANK
95.9%
6TH GRADE
0.0/ 100
METRIC RATING
296th/ 347
METRIC RANK
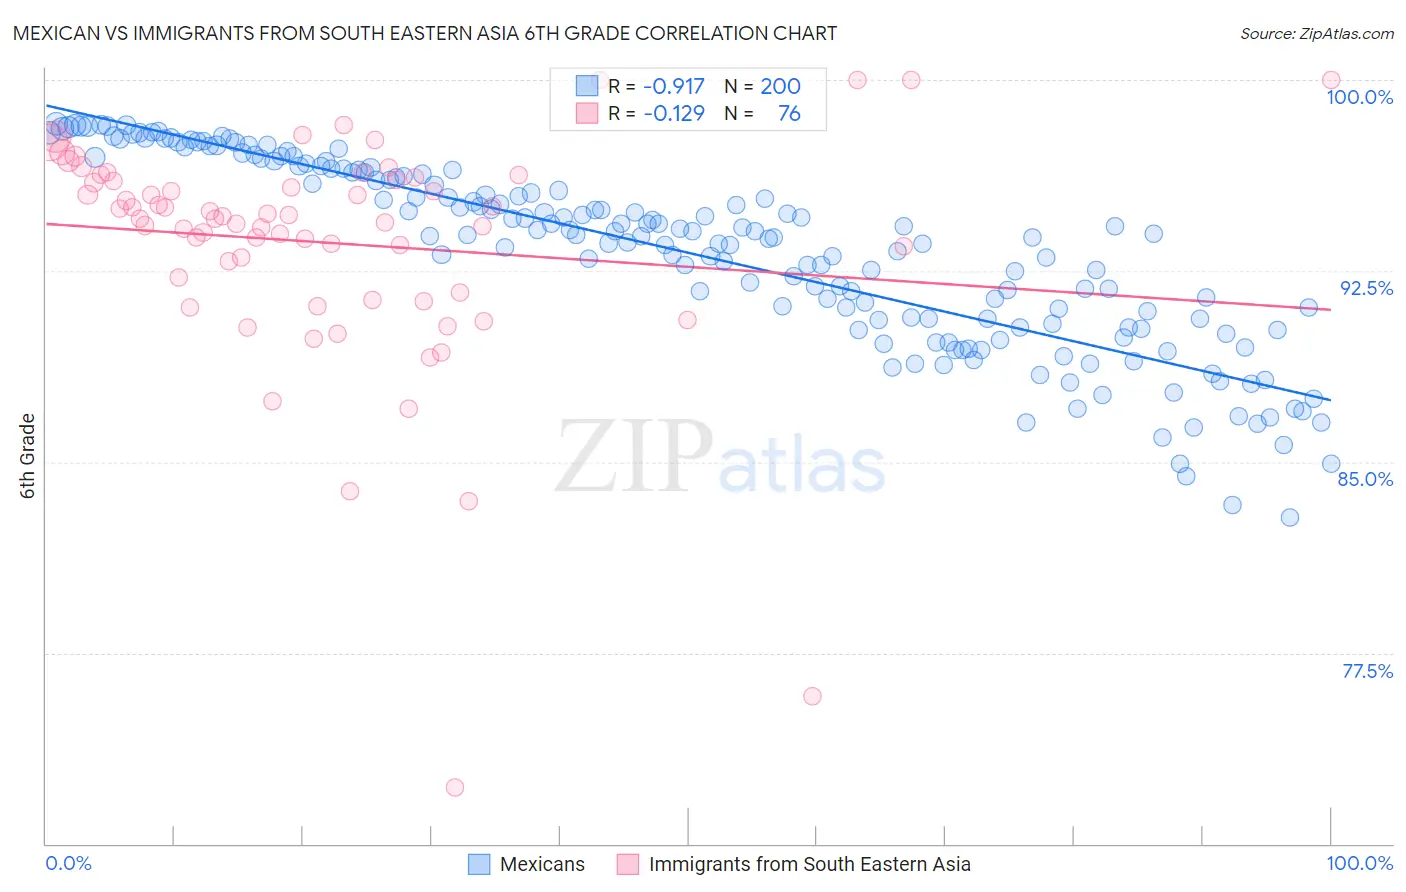
Mexican vs Immigrants from South Eastern Asia 6th Grade Correlation Chart
The statistical analysis conducted on geographies consisting of 565,340,263 people shows a near-perfect negative correlation between the proportion of Mexicans and percentage of population with at least 6th grade education in the United States with a correlation coefficient (R) of -0.917 and weighted average of 94.6%. Similarly, the statistical analysis conducted on geographies consisting of 512,710,223 people shows a poor negative correlation between the proportion of Immigrants from South Eastern Asia and percentage of population with at least 6th grade education in the United States with a correlation coefficient (R) of -0.129 and weighted average of 95.9%, a difference of 1.4%.
6th Grade Correlation Summary
| Measurement | Mexican | Immigrants from South Eastern Asia |
| Minimum | 82.8% | 72.2% |
| Maximum | 98.3% | 100.0% |
| Range | 15.5% | 27.8% |
| Mean | 93.2% | 93.6% |
| Median | 93.9% | 94.6% |
| Interquartile 25% (IQ1) | 90.5% | 91.9% |
| Interquartile 75% (IQ3) | 96.4% | 96.1% |
| Interquartile Range (IQR) | 5.9% | 4.2% |
| Standard Deviation (Sample) | 3.7% | 4.6% |
| Standard Deviation (Population) | 3.6% | 4.6% |
Similar Demographics by 6th Grade
Demographics Similar to Mexicans by 6th Grade
In terms of 6th grade, the demographic groups most similar to Mexicans are Immigrants from the Azores (94.7%, a difference of 0.020%), Immigrants from Dominican Republic (94.6%, a difference of 0.020%), Immigrants from Latin America (94.7%, a difference of 0.040%), Immigrants from Honduras (94.8%, a difference of 0.12%), and Central American (94.5%, a difference of 0.20%).
| Demographics | Rating | Rank | 6th Grade |
| Hondurans | 0.0 /100 | #328 | Tragic 95.0% |
| Dominicans | 0.0 /100 | #329 | Tragic 94.9% |
| Nepalese | 0.0 /100 | #330 | Tragic 94.9% |
| Immigrants | Armenia | 0.0 /100 | #331 | Tragic 94.9% |
| Immigrants | Honduras | 0.0 /100 | #332 | Tragic 94.8% |
| Immigrants | Latin America | 0.0 /100 | #333 | Tragic 94.7% |
| Immigrants | Azores | 0.0 /100 | #334 | Tragic 94.7% |
| Mexicans | 0.0 /100 | #335 | Tragic 94.6% |
| Immigrants | Dominican Republic | 0.0 /100 | #336 | Tragic 94.6% |
| Central Americans | 0.0 /100 | #337 | Tragic 94.5% |
| Immigrants | Cabo Verde | 0.0 /100 | #338 | Tragic 94.4% |
| Yakama | 0.0 /100 | #339 | Tragic 94.3% |
| Guatemalans | 0.0 /100 | #340 | Tragic 94.2% |
| Immigrants | Yemen | 0.0 /100 | #341 | Tragic 94.1% |
| Immigrants | Central America | 0.0 /100 | #342 | Tragic 94.0% |
Demographics Similar to Immigrants from South Eastern Asia by 6th Grade
In terms of 6th grade, the demographic groups most similar to Immigrants from South Eastern Asia are Immigrants from Grenada (95.9%, a difference of 0.010%), British West Indian (96.0%, a difference of 0.070%), Haitian (95.8%, a difference of 0.11%), Immigrants from West Indies (96.1%, a difference of 0.14%), and Immigrants from Barbados (96.1%, a difference of 0.18%).
| Demographics | Rating | Rank | 6th Grade |
| Immigrants | Eritrea | 0.0 /100 | #289 | Tragic 96.1% |
| Immigrants | Somalia | 0.0 /100 | #290 | Tragic 96.1% |
| Immigrants | St. Vincent and the Grenadines | 0.0 /100 | #291 | Tragic 96.1% |
| Immigrants | Barbados | 0.0 /100 | #292 | Tragic 96.1% |
| Immigrants | West Indies | 0.0 /100 | #293 | Tragic 96.1% |
| British West Indians | 0.0 /100 | #294 | Tragic 96.0% |
| Immigrants | Grenada | 0.0 /100 | #295 | Tragic 95.9% |
| Immigrants | South Eastern Asia | 0.0 /100 | #296 | Tragic 95.9% |
| Haitians | 0.0 /100 | #297 | Tragic 95.8% |
| Sri Lankans | 0.0 /100 | #298 | Tragic 95.8% |
| Immigrants | Laos | 0.0 /100 | #299 | Tragic 95.7% |
| Immigrants | Dominica | 0.0 /100 | #300 | Tragic 95.7% |
| Immigrants | Immigrants | 0.0 /100 | #301 | Tragic 95.7% |
| Immigrants | Burma/Myanmar | 0.0 /100 | #302 | Tragic 95.7% |
| Bangladeshis | 0.0 /100 | #303 | Tragic 95.7% |