Seminole vs Immigrants from Cambodia High School Diploma
COMPARE
Seminole
Immigrants from Cambodia
High School Diploma
High School Diploma Comparison
Seminole
Immigrants from Cambodia
87.3%
HIGH SCHOOL DIPLOMA
0.4/ 100
METRIC RATING
261st/ 347
METRIC RANK
85.6%
HIGH SCHOOL DIPLOMA
0.0/ 100
METRIC RATING
296th/ 347
METRIC RANK
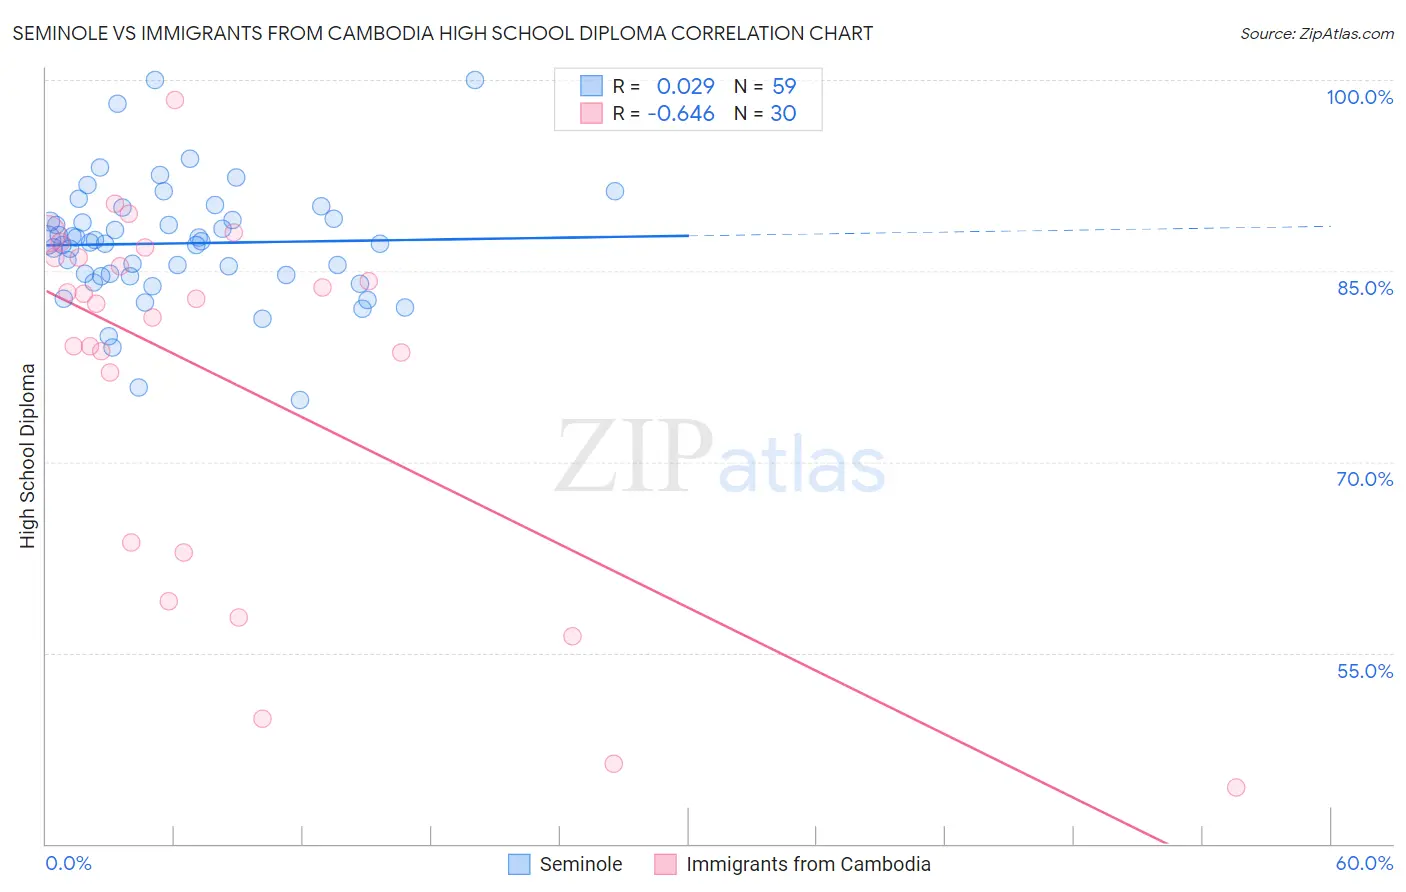
Seminole vs Immigrants from Cambodia High School Diploma Correlation Chart
The statistical analysis conducted on geographies consisting of 118,313,988 people shows no correlation between the proportion of Seminole and percentage of population with at least high school diploma education in the United States with a correlation coefficient (R) of 0.029 and weighted average of 87.3%. Similarly, the statistical analysis conducted on geographies consisting of 205,153,442 people shows a significant negative correlation between the proportion of Immigrants from Cambodia and percentage of population with at least high school diploma education in the United States with a correlation coefficient (R) of -0.646 and weighted average of 85.6%, a difference of 1.9%.
High School Diploma Correlation Summary
| Measurement | Seminole | Immigrants from Cambodia |
| Minimum | 74.9% | 44.4% |
| Maximum | 100.0% | 98.4% |
| Range | 25.1% | 54.0% |
| Mean | 87.2% | 76.7% |
| Median | 87.2% | 82.6% |
| Interquartile 25% (IQ1) | 84.6% | 63.7% |
| Interquartile 75% (IQ3) | 89.1% | 86.1% |
| Interquartile Range (IQR) | 4.5% | 22.4% |
| Standard Deviation (Sample) | 4.8% | 14.4% |
| Standard Deviation (Population) | 4.7% | 14.1% |
Similar Demographics by High School Diploma
Demographics Similar to Seminole by High School Diploma
In terms of high school diploma, the demographic groups most similar to Seminole are Cajun (87.3%, a difference of 0.020%), Immigrants from Peru (87.3%, a difference of 0.030%), Immigrants from South Eastern Asia (87.2%, a difference of 0.060%), Jamaican (87.2%, a difference of 0.080%), and Immigrants from Ghana (87.4%, a difference of 0.10%).
| Demographics | Rating | Rank | High School Diploma |
| Immigrants | Colombia | 1.0 /100 | #254 | Tragic 87.6% |
| Immigrants | Senegal | 0.9 /100 | #255 | Tragic 87.6% |
| Africans | 0.7 /100 | #256 | Tragic 87.5% |
| Bahamians | 0.7 /100 | #257 | Tragic 87.5% |
| Immigrants | Ghana | 0.5 /100 | #258 | Tragic 87.4% |
| Immigrants | Western Africa | 0.5 /100 | #259 | Tragic 87.4% |
| Cajuns | 0.4 /100 | #260 | Tragic 87.3% |
| Seminole | 0.4 /100 | #261 | Tragic 87.3% |
| Immigrants | Peru | 0.4 /100 | #262 | Tragic 87.3% |
| Immigrants | South Eastern Asia | 0.3 /100 | #263 | Tragic 87.2% |
| Jamaicans | 0.3 /100 | #264 | Tragic 87.2% |
| U.S. Virgin Islanders | 0.2 /100 | #265 | Tragic 87.1% |
| Immigrants | Congo | 0.2 /100 | #266 | Tragic 87.0% |
| Blacks/African Americans | 0.2 /100 | #267 | Tragic 87.0% |
| Pennsylvania Germans | 0.2 /100 | #268 | Tragic 87.0% |
Demographics Similar to Immigrants from Cambodia by High School Diploma
In terms of high school diploma, the demographic groups most similar to Immigrants from Cambodia are Immigrants from Grenada (85.6%, a difference of 0.070%), Native/Alaskan (85.6%, a difference of 0.090%), Guyanese (85.5%, a difference of 0.18%), Immigrants (85.8%, a difference of 0.21%), and Immigrants from Bangladesh (85.5%, a difference of 0.21%).
| Demographics | Rating | Rank | High School Diploma |
| Yup'ik | 0.0 /100 | #289 | Tragic 86.1% |
| Fijians | 0.0 /100 | #290 | Tragic 86.0% |
| Haitians | 0.0 /100 | #291 | Tragic 85.9% |
| Japanese | 0.0 /100 | #292 | Tragic 85.9% |
| British West Indians | 0.0 /100 | #293 | Tragic 85.9% |
| Immigrants | Fiji | 0.0 /100 | #294 | Tragic 85.8% |
| Immigrants | Immigrants | 0.0 /100 | #295 | Tragic 85.8% |
| Immigrants | Cambodia | 0.0 /100 | #296 | Tragic 85.6% |
| Immigrants | Grenada | 0.0 /100 | #297 | Tragic 85.6% |
| Natives/Alaskans | 0.0 /100 | #298 | Tragic 85.6% |
| Guyanese | 0.0 /100 | #299 | Tragic 85.5% |
| Immigrants | Bangladesh | 0.0 /100 | #300 | Tragic 85.5% |
| Vietnamese | 0.0 /100 | #301 | Tragic 85.4% |
| Immigrants | Haiti | 0.0 /100 | #302 | Tragic 85.4% |
| Cubans | 0.0 /100 | #303 | Tragic 85.4% |