Cape Verdean vs Immigrants from Cambodia High School Diploma
COMPARE
Cape Verdean
Immigrants from Cambodia
High School Diploma
High School Diploma Comparison
Cape Verdeans
Immigrants from Cambodia
85.1%
HIGH SCHOOL DIPLOMA
0.0/ 100
METRIC RATING
312th/ 347
METRIC RANK
85.6%
HIGH SCHOOL DIPLOMA
0.0/ 100
METRIC RATING
296th/ 347
METRIC RANK
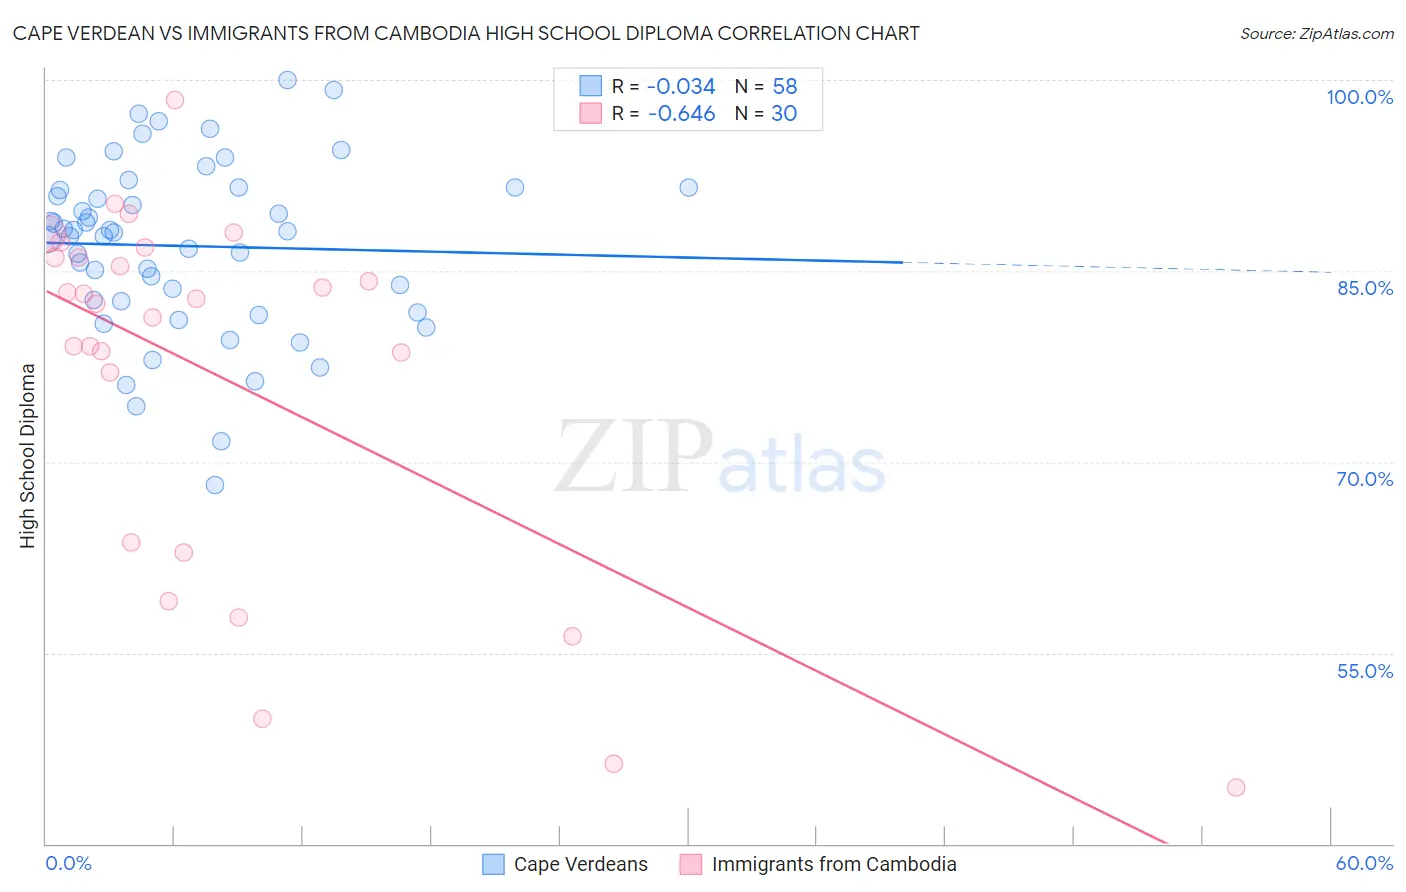
Cape Verdean vs Immigrants from Cambodia High School Diploma Correlation Chart
The statistical analysis conducted on geographies consisting of 107,537,955 people shows no correlation between the proportion of Cape Verdeans and percentage of population with at least high school diploma education in the United States with a correlation coefficient (R) of -0.034 and weighted average of 85.1%. Similarly, the statistical analysis conducted on geographies consisting of 205,153,442 people shows a significant negative correlation between the proportion of Immigrants from Cambodia and percentage of population with at least high school diploma education in the United States with a correlation coefficient (R) of -0.646 and weighted average of 85.6%, a difference of 0.68%.
High School Diploma Correlation Summary
| Measurement | Cape Verdean | Immigrants from Cambodia |
| Minimum | 68.1% | 44.4% |
| Maximum | 100.0% | 98.4% |
| Range | 31.9% | 54.0% |
| Mean | 87.0% | 76.7% |
| Median | 88.1% | 82.6% |
| Interquartile 25% (IQ1) | 82.7% | 63.7% |
| Interquartile 75% (IQ3) | 91.5% | 86.1% |
| Interquartile Range (IQR) | 8.9% | 22.4% |
| Standard Deviation (Sample) | 6.8% | 14.4% |
| Standard Deviation (Population) | 6.7% | 14.1% |
Demographics Similar to Cape Verdeans and Immigrants from Cambodia by High School Diploma
In terms of high school diploma, the demographic groups most similar to Cape Verdeans are Ecuadorian (85.1%, a difference of 0.050%), Apache (85.1%, a difference of 0.060%), Immigrants from Dominica (85.2%, a difference of 0.14%), Immigrants from Armenia (85.2%, a difference of 0.15%), and Navajo (85.2%, a difference of 0.16%). Similarly, the demographic groups most similar to Immigrants from Cambodia are Immigrants from Grenada (85.6%, a difference of 0.070%), Native/Alaskan (85.6%, a difference of 0.090%), Guyanese (85.5%, a difference of 0.18%), Immigrants (85.8%, a difference of 0.21%), and Immigrants from Bangladesh (85.5%, a difference of 0.21%).
| Demographics | Rating | Rank | High School Diploma |
| Immigrants | Fiji | 0.0 /100 | #294 | Tragic 85.8% |
| Immigrants | Immigrants | 0.0 /100 | #295 | Tragic 85.8% |
| Immigrants | Cambodia | 0.0 /100 | #296 | Tragic 85.6% |
| Immigrants | Grenada | 0.0 /100 | #297 | Tragic 85.6% |
| Natives/Alaskans | 0.0 /100 | #298 | Tragic 85.6% |
| Guyanese | 0.0 /100 | #299 | Tragic 85.5% |
| Immigrants | Bangladesh | 0.0 /100 | #300 | Tragic 85.5% |
| Vietnamese | 0.0 /100 | #301 | Tragic 85.4% |
| Immigrants | Haiti | 0.0 /100 | #302 | Tragic 85.4% |
| Cubans | 0.0 /100 | #303 | Tragic 85.4% |
| Nepalese | 0.0 /100 | #304 | Tragic 85.3% |
| Immigrants | Portugal | 0.0 /100 | #305 | Tragic 85.3% |
| Immigrants | Guyana | 0.0 /100 | #306 | Tragic 85.3% |
| Navajo | 0.0 /100 | #307 | Tragic 85.2% |
| Immigrants | Armenia | 0.0 /100 | #308 | Tragic 85.2% |
| Immigrants | Dominica | 0.0 /100 | #309 | Tragic 85.2% |
| Apache | 0.0 /100 | #310 | Tragic 85.1% |
| Ecuadorians | 0.0 /100 | #311 | Tragic 85.1% |
| Cape Verdeans | 0.0 /100 | #312 | Tragic 85.1% |
| Immigrants | Ecuador | 0.0 /100 | #313 | Tragic 84.8% |
| Yaqui | 0.0 /100 | #314 | Tragic 84.7% |