Seminole vs Assyrian/Chaldean/Syriac High School Diploma
COMPARE
Seminole
Assyrian/Chaldean/Syriac
High School Diploma
High School Diploma Comparison
Seminole
Assyrians/Chaldeans/Syriacs
87.3%
HIGH SCHOOL DIPLOMA
0.4/ 100
METRIC RATING
261st/ 347
METRIC RANK
89.7%
HIGH SCHOOL DIPLOMA
82.5/ 100
METRIC RATING
138th/ 347
METRIC RANK
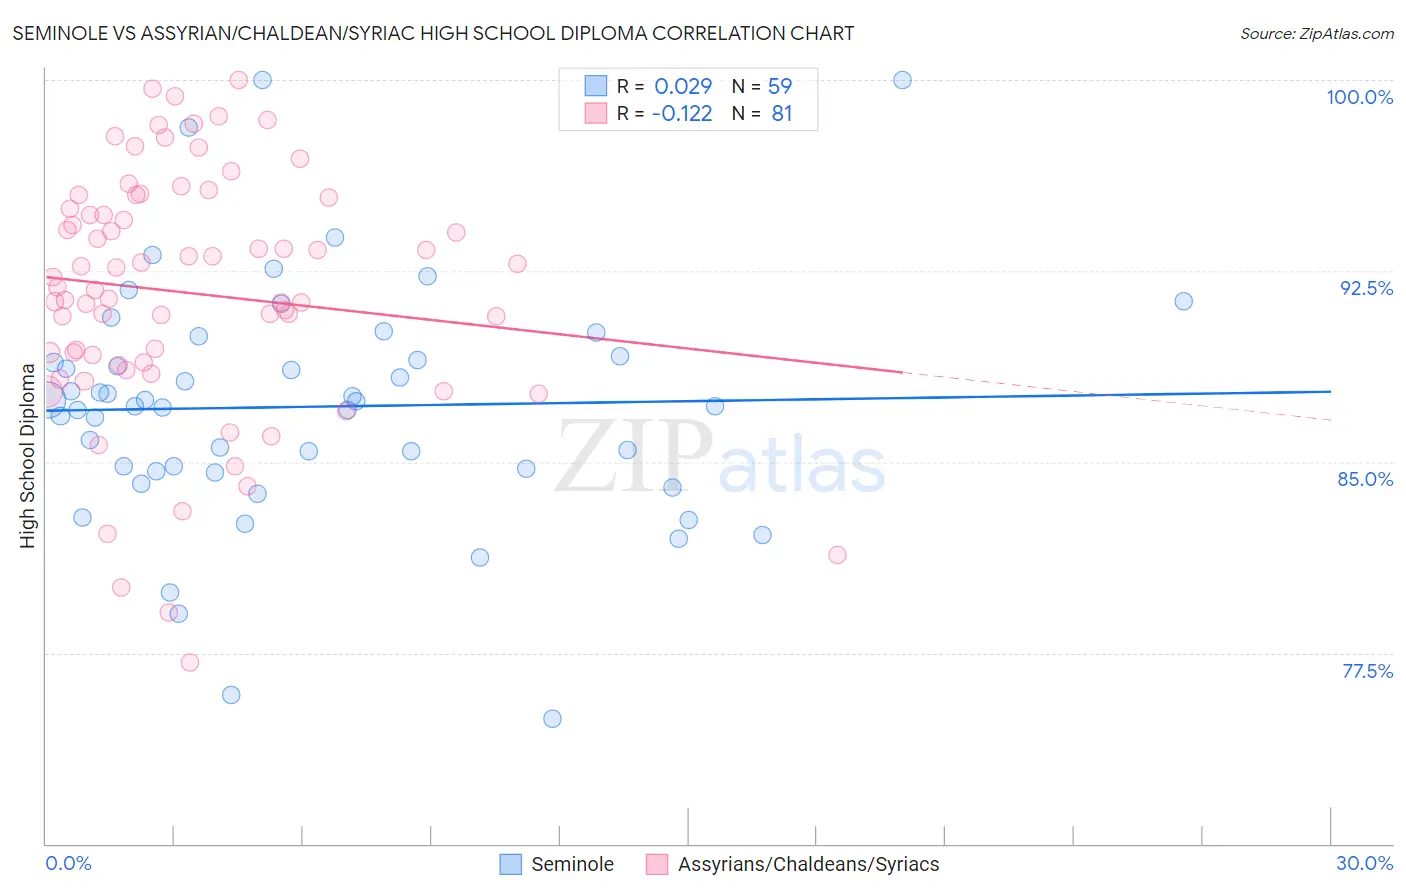
Seminole vs Assyrian/Chaldean/Syriac High School Diploma Correlation Chart
The statistical analysis conducted on geographies consisting of 118,313,988 people shows no correlation between the proportion of Seminole and percentage of population with at least high school diploma education in the United States with a correlation coefficient (R) of 0.029 and weighted average of 87.3%. Similarly, the statistical analysis conducted on geographies consisting of 110,318,304 people shows a poor negative correlation between the proportion of Assyrians/Chaldeans/Syriacs and percentage of population with at least high school diploma education in the United States with a correlation coefficient (R) of -0.122 and weighted average of 89.7%, a difference of 2.7%.
High School Diploma Correlation Summary
| Measurement | Seminole | Assyrian/Chaldean/Syriac |
| Minimum | 74.9% | 77.1% |
| Maximum | 100.0% | 100.0% |
| Range | 25.1% | 22.9% |
| Mean | 87.2% | 91.6% |
| Median | 87.2% | 91.9% |
| Interquartile 25% (IQ1) | 84.6% | 88.8% |
| Interquartile 75% (IQ3) | 89.1% | 95.2% |
| Interquartile Range (IQR) | 4.5% | 6.3% |
| Standard Deviation (Sample) | 4.8% | 4.9% |
| Standard Deviation (Population) | 4.7% | 4.8% |
Similar Demographics by High School Diploma
Demographics Similar to Seminole by High School Diploma
In terms of high school diploma, the demographic groups most similar to Seminole are Cajun (87.3%, a difference of 0.020%), Immigrants from Peru (87.3%, a difference of 0.030%), Immigrants from South Eastern Asia (87.2%, a difference of 0.060%), Jamaican (87.2%, a difference of 0.080%), and Immigrants from Ghana (87.4%, a difference of 0.10%).
| Demographics | Rating | Rank | High School Diploma |
| Immigrants | Colombia | 1.0 /100 | #254 | Tragic 87.6% |
| Immigrants | Senegal | 0.9 /100 | #255 | Tragic 87.6% |
| Africans | 0.7 /100 | #256 | Tragic 87.5% |
| Bahamians | 0.7 /100 | #257 | Tragic 87.5% |
| Immigrants | Ghana | 0.5 /100 | #258 | Tragic 87.4% |
| Immigrants | Western Africa | 0.5 /100 | #259 | Tragic 87.4% |
| Cajuns | 0.4 /100 | #260 | Tragic 87.3% |
| Seminole | 0.4 /100 | #261 | Tragic 87.3% |
| Immigrants | Peru | 0.4 /100 | #262 | Tragic 87.3% |
| Immigrants | South Eastern Asia | 0.3 /100 | #263 | Tragic 87.2% |
| Jamaicans | 0.3 /100 | #264 | Tragic 87.2% |
| U.S. Virgin Islanders | 0.2 /100 | #265 | Tragic 87.1% |
| Immigrants | Congo | 0.2 /100 | #266 | Tragic 87.0% |
| Blacks/African Americans | 0.2 /100 | #267 | Tragic 87.0% |
| Pennsylvania Germans | 0.2 /100 | #268 | Tragic 87.0% |
Demographics Similar to Assyrians/Chaldeans/Syriacs by High School Diploma
In terms of high school diploma, the demographic groups most similar to Assyrians/Chaldeans/Syriacs are Ugandan (89.7%, a difference of 0.030%), Arab (89.7%, a difference of 0.030%), Kenyan (89.6%, a difference of 0.030%), Immigrants from Egypt (89.6%, a difference of 0.030%), and Chilean (89.6%, a difference of 0.080%).
| Demographics | Rating | Rank | High School Diploma |
| Immigrants | Italy | 87.4 /100 | #131 | Excellent 89.8% |
| Immigrants | Bosnia and Herzegovina | 87.3 /100 | #132 | Excellent 89.8% |
| Albanians | 87.2 /100 | #133 | Excellent 89.8% |
| Immigrants | Jordan | 87.2 /100 | #134 | Excellent 89.8% |
| Chippewa | 85.6 /100 | #135 | Excellent 89.7% |
| Ugandans | 83.7 /100 | #136 | Excellent 89.7% |
| Arabs | 83.6 /100 | #137 | Excellent 89.7% |
| Assyrians/Chaldeans/Syriacs | 82.5 /100 | #138 | Excellent 89.7% |
| Kenyans | 81.4 /100 | #139 | Excellent 89.6% |
| Immigrants | Egypt | 81.2 /100 | #140 | Excellent 89.6% |
| Chileans | 79.0 /100 | #141 | Good 89.6% |
| Indians (Asian) | 78.8 /100 | #142 | Good 89.6% |
| Pakistanis | 78.3 /100 | #143 | Good 89.6% |
| Immigrants | Kenya | 78.0 /100 | #144 | Good 89.6% |
| Immigrants | Brazil | 76.6 /100 | #145 | Good 89.5% |