Immigrants from Switzerland vs Immigrants from Cambodia High School Diploma
COMPARE
Immigrants from Switzerland
Immigrants from Cambodia
High School Diploma
High School Diploma Comparison
Immigrants from Switzerland
Immigrants from Cambodia
90.8%
HIGH SCHOOL DIPLOMA
99.3/ 100
METRIC RATING
81st/ 347
METRIC RANK
85.6%
HIGH SCHOOL DIPLOMA
0.0/ 100
METRIC RATING
296th/ 347
METRIC RANK
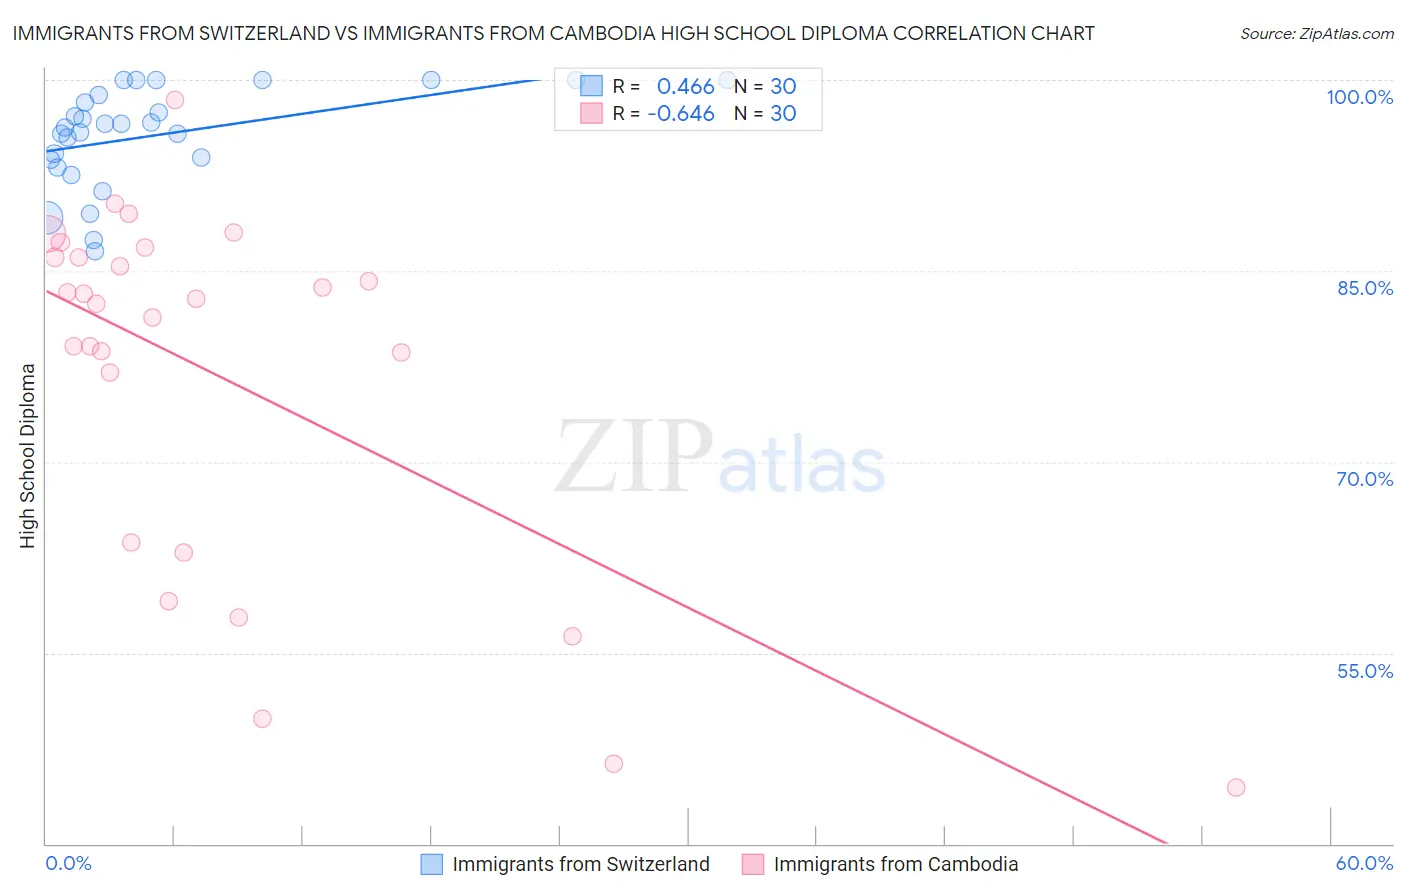
Immigrants from Switzerland vs Immigrants from Cambodia High School Diploma Correlation Chart
The statistical analysis conducted on geographies consisting of 148,083,583 people shows a moderate positive correlation between the proportion of Immigrants from Switzerland and percentage of population with at least high school diploma education in the United States with a correlation coefficient (R) of 0.466 and weighted average of 90.8%. Similarly, the statistical analysis conducted on geographies consisting of 205,153,442 people shows a significant negative correlation between the proportion of Immigrants from Cambodia and percentage of population with at least high school diploma education in the United States with a correlation coefficient (R) of -0.646 and weighted average of 85.6%, a difference of 6.0%.
High School Diploma Correlation Summary
| Measurement | Immigrants from Switzerland | Immigrants from Cambodia |
| Minimum | 86.5% | 44.4% |
| Maximum | 100.0% | 98.4% |
| Range | 13.5% | 54.0% |
| Mean | 95.6% | 76.7% |
| Median | 96.4% | 82.6% |
| Interquartile 25% (IQ1) | 93.7% | 63.7% |
| Interquartile 75% (IQ3) | 98.8% | 86.1% |
| Interquartile Range (IQR) | 5.1% | 22.4% |
| Standard Deviation (Sample) | 3.9% | 14.4% |
| Standard Deviation (Population) | 3.8% | 14.1% |
Similar Demographics by High School Diploma
Demographics Similar to Immigrants from Switzerland by High School Diploma
In terms of high school diploma, the demographic groups most similar to Immigrants from Switzerland are Immigrants from England (90.8%, a difference of 0.0%), Immigrants from Denmark (90.8%, a difference of 0.010%), Native Hawaiian (90.8%, a difference of 0.020%), Burmese (90.8%, a difference of 0.020%), and Hungarian (90.8%, a difference of 0.030%).
| Demographics | Rating | Rank | High School Diploma |
| Immigrants | Czechoslovakia | 99.4 /100 | #74 | Exceptional 90.9% |
| Cambodians | 99.4 /100 | #75 | Exceptional 90.8% |
| Hungarians | 99.3 /100 | #76 | Exceptional 90.8% |
| Native Hawaiians | 99.3 /100 | #77 | Exceptional 90.8% |
| Burmese | 99.3 /100 | #78 | Exceptional 90.8% |
| Immigrants | Denmark | 99.3 /100 | #79 | Exceptional 90.8% |
| Immigrants | England | 99.3 /100 | #80 | Exceptional 90.8% |
| Immigrants | Switzerland | 99.3 /100 | #81 | Exceptional 90.8% |
| Scotch-Irish | 99.2 /100 | #82 | Exceptional 90.8% |
| Immigrants | Moldova | 99.2 /100 | #83 | Exceptional 90.7% |
| Immigrants | Saudi Arabia | 99.1 /100 | #84 | Exceptional 90.7% |
| Romanians | 98.9 /100 | #85 | Exceptional 90.7% |
| Immigrants | Bulgaria | 98.9 /100 | #86 | Exceptional 90.6% |
| Immigrants | Turkey | 98.9 /100 | #87 | Exceptional 90.6% |
| Immigrants | France | 98.8 /100 | #88 | Exceptional 90.6% |
Demographics Similar to Immigrants from Cambodia by High School Diploma
In terms of high school diploma, the demographic groups most similar to Immigrants from Cambodia are Immigrants from Grenada (85.6%, a difference of 0.070%), Native/Alaskan (85.6%, a difference of 0.090%), Guyanese (85.5%, a difference of 0.18%), Immigrants (85.8%, a difference of 0.21%), and Immigrants from Bangladesh (85.5%, a difference of 0.21%).
| Demographics | Rating | Rank | High School Diploma |
| Yup'ik | 0.0 /100 | #289 | Tragic 86.1% |
| Fijians | 0.0 /100 | #290 | Tragic 86.0% |
| Haitians | 0.0 /100 | #291 | Tragic 85.9% |
| Japanese | 0.0 /100 | #292 | Tragic 85.9% |
| British West Indians | 0.0 /100 | #293 | Tragic 85.9% |
| Immigrants | Fiji | 0.0 /100 | #294 | Tragic 85.8% |
| Immigrants | Immigrants | 0.0 /100 | #295 | Tragic 85.8% |
| Immigrants | Cambodia | 0.0 /100 | #296 | Tragic 85.6% |
| Immigrants | Grenada | 0.0 /100 | #297 | Tragic 85.6% |
| Natives/Alaskans | 0.0 /100 | #298 | Tragic 85.6% |
| Guyanese | 0.0 /100 | #299 | Tragic 85.5% |
| Immigrants | Bangladesh | 0.0 /100 | #300 | Tragic 85.5% |
| Vietnamese | 0.0 /100 | #301 | Tragic 85.4% |
| Immigrants | Haiti | 0.0 /100 | #302 | Tragic 85.4% |
| Cubans | 0.0 /100 | #303 | Tragic 85.4% |