Scottish vs Inupiat 9th Grade
COMPARE
Scottish
Inupiat
9th Grade
9th Grade Comparison
Scottish
Inupiat
96.5%
9TH GRADE
100.0/ 100
METRIC RATING
14th/ 347
METRIC RANK
95.8%
9TH GRADE
99.5/ 100
METRIC RATING
75th/ 347
METRIC RANK
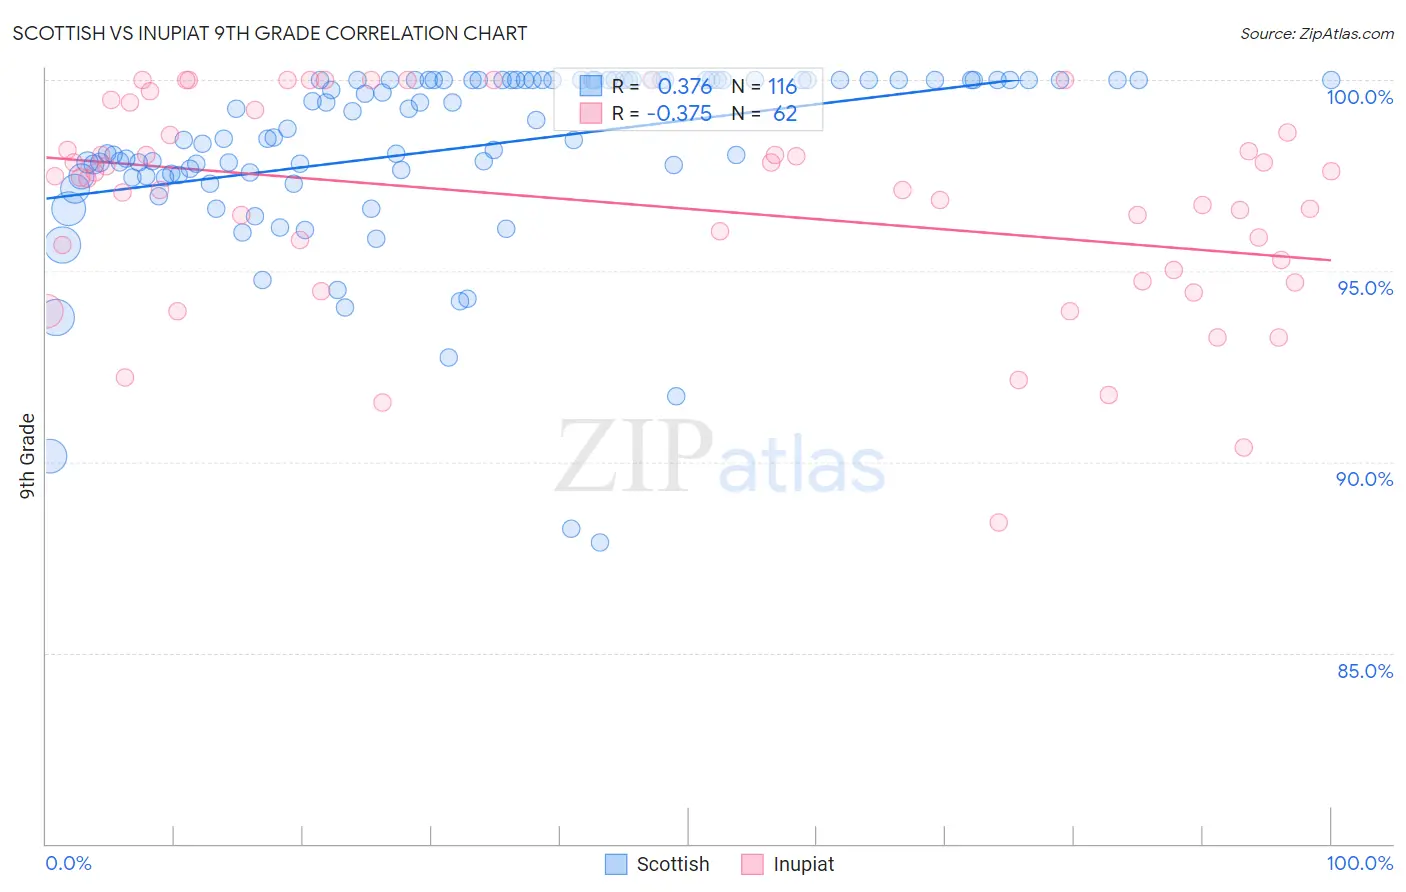
Scottish vs Inupiat 9th Grade Correlation Chart
The statistical analysis conducted on geographies consisting of 567,141,209 people shows a mild positive correlation between the proportion of Scottish and percentage of population with at least 9th grade education in the United States with a correlation coefficient (R) of 0.376 and weighted average of 96.5%. Similarly, the statistical analysis conducted on geographies consisting of 96,349,180 people shows a mild negative correlation between the proportion of Inupiat and percentage of population with at least 9th grade education in the United States with a correlation coefficient (R) of -0.375 and weighted average of 95.8%, a difference of 0.78%.
9th Grade Correlation Summary
| Measurement | Scottish | Inupiat |
| Minimum | 87.9% | 88.4% |
| Maximum | 100.0% | 100.0% |
| Range | 12.1% | 11.6% |
| Mean | 98.2% | 96.8% |
| Median | 98.8% | 97.4% |
| Interquartile 25% (IQ1) | 97.5% | 95.0% |
| Interquartile 75% (IQ3) | 100.0% | 98.6% |
| Interquartile Range (IQR) | 2.5% | 3.6% |
| Standard Deviation (Sample) | 2.4% | 2.7% |
| Standard Deviation (Population) | 2.4% | 2.7% |
Similar Demographics by 9th Grade
Demographics Similar to Scottish by 9th Grade
In terms of 9th grade, the demographic groups most similar to Scottish are Irish (96.5%, a difference of 0.0%), Croatian (96.5%, a difference of 0.0%), Danish (96.5%, a difference of 0.010%), English (96.6%, a difference of 0.050%), and Lithuanian (96.6%, a difference of 0.070%).
| Demographics | Rating | Rank | 9th Grade |
| Carpatho Rusyns | 100.0 /100 | #7 | Exceptional 96.7% |
| Germans | 100.0 /100 | #8 | Exceptional 96.7% |
| Tlingit-Haida | 100.0 /100 | #9 | Exceptional 96.6% |
| Lithuanians | 100.0 /100 | #10 | Exceptional 96.6% |
| Finns | 100.0 /100 | #11 | Exceptional 96.6% |
| English | 100.0 /100 | #12 | Exceptional 96.6% |
| Danes | 100.0 /100 | #13 | Exceptional 96.5% |
| Scottish | 100.0 /100 | #14 | Exceptional 96.5% |
| Irish | 100.0 /100 | #15 | Exceptional 96.5% |
| Croatians | 100.0 /100 | #16 | Exceptional 96.5% |
| Dutch | 100.0 /100 | #17 | Exceptional 96.5% |
| Scandinavians | 100.0 /100 | #18 | Exceptional 96.5% |
| Welsh | 100.0 /100 | #19 | Exceptional 96.4% |
| Italians | 100.0 /100 | #20 | Exceptional 96.4% |
| Alaskan Athabascans | 100.0 /100 | #21 | Exceptional 96.4% |
Demographics Similar to Inupiat by 9th Grade
In terms of 9th grade, the demographic groups most similar to Inupiat are Thai (95.8%, a difference of 0.010%), Immigrants from Sweden (95.8%, a difference of 0.010%), White/Caucasian (95.8%, a difference of 0.010%), Immigrants from South Africa (95.8%, a difference of 0.010%), and Immigrants from Belgium (95.8%, a difference of 0.020%).
| Demographics | Rating | Rank | 9th Grade |
| Immigrants | Ireland | 99.6 /100 | #68 | Exceptional 95.8% |
| Immigrants | Lithuania | 99.6 /100 | #69 | Exceptional 95.8% |
| Immigrants | Australia | 99.5 /100 | #70 | Exceptional 95.8% |
| Immigrants | Belgium | 99.5 /100 | #71 | Exceptional 95.8% |
| Turks | 99.5 /100 | #72 | Exceptional 95.8% |
| Immigrants | Singapore | 99.5 /100 | #73 | Exceptional 95.8% |
| Thais | 99.5 /100 | #74 | Exceptional 95.8% |
| Inupiat | 99.5 /100 | #75 | Exceptional 95.8% |
| Immigrants | Sweden | 99.5 /100 | #76 | Exceptional 95.8% |
| Whites/Caucasians | 99.4 /100 | #77 | Exceptional 95.8% |
| Immigrants | South Africa | 99.4 /100 | #78 | Exceptional 95.8% |
| Romanians | 99.3 /100 | #79 | Exceptional 95.7% |
| Bhutanese | 99.3 /100 | #80 | Exceptional 95.7% |
| Arapaho | 99.3 /100 | #81 | Exceptional 95.7% |
| Puget Sound Salish | 99.2 /100 | #82 | Exceptional 95.7% |