Scottish vs Chilean 9th Grade
COMPARE
Scottish
Chilean
9th Grade
9th Grade Comparison
Scottish
Chileans
96.5%
9TH GRADE
100.0/ 100
METRIC RATING
14th/ 347
METRIC RANK
95.0%
9TH GRADE
60.7/ 100
METRIC RATING
168th/ 347
METRIC RANK
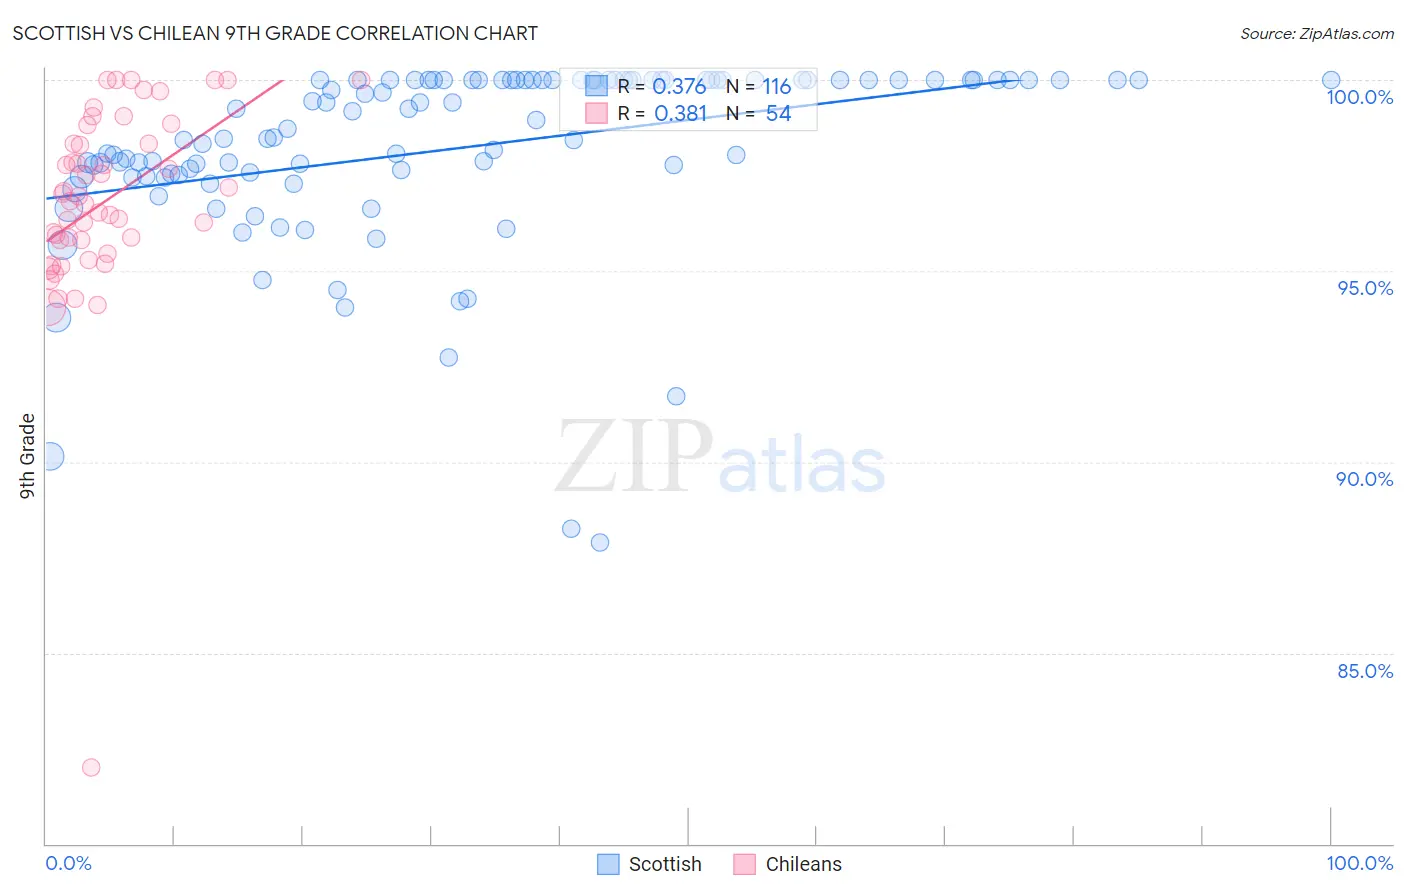
Scottish vs Chilean 9th Grade Correlation Chart
The statistical analysis conducted on geographies consisting of 567,141,209 people shows a mild positive correlation between the proportion of Scottish and percentage of population with at least 9th grade education in the United States with a correlation coefficient (R) of 0.376 and weighted average of 96.5%. Similarly, the statistical analysis conducted on geographies consisting of 256,683,580 people shows a mild positive correlation between the proportion of Chileans and percentage of population with at least 9th grade education in the United States with a correlation coefficient (R) of 0.381 and weighted average of 95.0%, a difference of 1.7%.
9th Grade Correlation Summary
| Measurement | Scottish | Chilean |
| Minimum | 87.9% | 82.0% |
| Maximum | 100.0% | 100.0% |
| Range | 12.1% | 18.0% |
| Mean | 98.2% | 96.8% |
| Median | 98.8% | 96.9% |
| Interquartile 25% (IQ1) | 97.5% | 95.8% |
| Interquartile 75% (IQ3) | 100.0% | 98.3% |
| Interquartile Range (IQR) | 2.5% | 2.5% |
| Standard Deviation (Sample) | 2.4% | 2.7% |
| Standard Deviation (Population) | 2.4% | 2.7% |
Similar Demographics by 9th Grade
Demographics Similar to Scottish by 9th Grade
In terms of 9th grade, the demographic groups most similar to Scottish are Irish (96.5%, a difference of 0.0%), Croatian (96.5%, a difference of 0.0%), Danish (96.5%, a difference of 0.010%), English (96.6%, a difference of 0.050%), and Lithuanian (96.6%, a difference of 0.070%).
| Demographics | Rating | Rank | 9th Grade |
| Carpatho Rusyns | 100.0 /100 | #7 | Exceptional 96.7% |
| Germans | 100.0 /100 | #8 | Exceptional 96.7% |
| Tlingit-Haida | 100.0 /100 | #9 | Exceptional 96.6% |
| Lithuanians | 100.0 /100 | #10 | Exceptional 96.6% |
| Finns | 100.0 /100 | #11 | Exceptional 96.6% |
| English | 100.0 /100 | #12 | Exceptional 96.6% |
| Danes | 100.0 /100 | #13 | Exceptional 96.5% |
| Scottish | 100.0 /100 | #14 | Exceptional 96.5% |
| Irish | 100.0 /100 | #15 | Exceptional 96.5% |
| Croatians | 100.0 /100 | #16 | Exceptional 96.5% |
| Dutch | 100.0 /100 | #17 | Exceptional 96.5% |
| Scandinavians | 100.0 /100 | #18 | Exceptional 96.5% |
| Welsh | 100.0 /100 | #19 | Exceptional 96.4% |
| Italians | 100.0 /100 | #20 | Exceptional 96.4% |
| Alaskan Athabascans | 100.0 /100 | #21 | Exceptional 96.4% |
Demographics Similar to Chileans by 9th Grade
In terms of 9th grade, the demographic groups most similar to Chileans are Immigrants from Brazil (95.0%, a difference of 0.0%), Ute (95.0%, a difference of 0.010%), Spaniard (94.9%, a difference of 0.010%), Venezuelan (95.0%, a difference of 0.020%), and Blackfeet (95.0%, a difference of 0.020%).
| Demographics | Rating | Rank | 9th Grade |
| French American Indians | 66.5 /100 | #161 | Good 95.0% |
| Bermudans | 65.8 /100 | #162 | Good 95.0% |
| Pakistanis | 64.1 /100 | #163 | Good 95.0% |
| Venezuelans | 63.6 /100 | #164 | Good 95.0% |
| Blackfeet | 62.6 /100 | #165 | Good 95.0% |
| Ute | 62.6 /100 | #166 | Good 95.0% |
| Immigrants | Brazil | 61.1 /100 | #167 | Good 95.0% |
| Chileans | 60.7 /100 | #168 | Good 95.0% |
| Spaniards | 59.6 /100 | #169 | Average 94.9% |
| Alsatians | 58.6 /100 | #170 | Average 94.9% |
| Colville | 58.5 /100 | #171 | Average 94.9% |
| Iraqis | 54.0 /100 | #172 | Average 94.9% |
| Cheyenne | 51.5 /100 | #173 | Average 94.9% |
| Immigrants | Egypt | 50.0 /100 | #174 | Average 94.9% |
| Brazilians | 49.8 /100 | #175 | Average 94.9% |