Scottish vs Arapaho 5th Grade
COMPARE
Scottish
Arapaho
5th Grade
5th Grade Comparison
Scottish
Arapaho
98.3%
5TH GRADE
100.0/ 100
METRIC RATING
15th/ 347
METRIC RANK
98.0%
5TH GRADE
99.9/ 100
METRIC RATING
46th/ 347
METRIC RANK
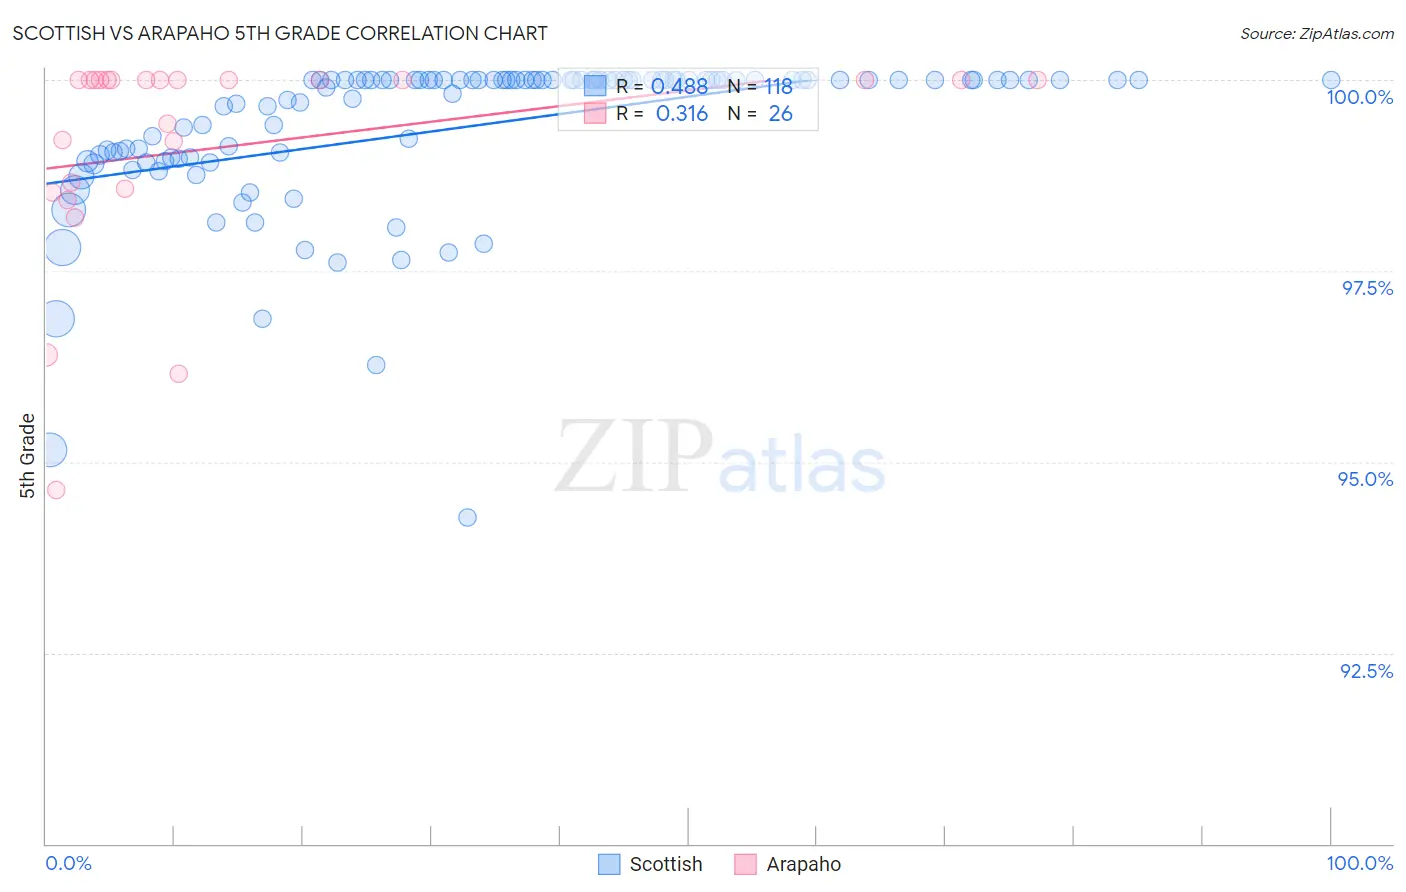
Scottish vs Arapaho 5th Grade Correlation Chart
The statistical analysis conducted on geographies consisting of 567,141,733 people shows a moderate positive correlation between the proportion of Scottish and percentage of population with at least 5th grade education in the United States with a correlation coefficient (R) of 0.488 and weighted average of 98.3%. Similarly, the statistical analysis conducted on geographies consisting of 29,780,295 people shows a mild positive correlation between the proportion of Arapaho and percentage of population with at least 5th grade education in the United States with a correlation coefficient (R) of 0.316 and weighted average of 98.0%, a difference of 0.28%.
5th Grade Correlation Summary
| Measurement | Scottish | Arapaho |
| Minimum | 94.3% | 94.6% |
| Maximum | 100.0% | 100.0% |
| Range | 5.7% | 5.4% |
| Mean | 99.4% | 99.1% |
| Median | 100.0% | 100.0% |
| Interquartile 25% (IQ1) | 99.0% | 98.6% |
| Interquartile 75% (IQ3) | 100.0% | 100.0% |
| Interquartile Range (IQR) | 1.0% | 1.4% |
| Standard Deviation (Sample) | 1.0% | 1.4% |
| Standard Deviation (Population) | 1.0% | 1.4% |
Similar Demographics by 5th Grade
Demographics Similar to Scottish by 5th Grade
In terms of 5th grade, the demographic groups most similar to Scottish are Dutch (98.3%, a difference of 0.010%), Polish (98.3%, a difference of 0.010%), Tlingit-Haida (98.3%, a difference of 0.020%), Irish (98.3%, a difference of 0.020%), and Pennsylvania German (98.3%, a difference of 0.020%).
| Demographics | Rating | Rank | 5th Grade |
| Slovenes | 100.0 /100 | #8 | Exceptional 98.3% |
| Swedes | 100.0 /100 | #9 | Exceptional 98.3% |
| English | 100.0 /100 | #10 | Exceptional 98.3% |
| Alaskan Athabascans | 100.0 /100 | #11 | Exceptional 98.3% |
| Carpatho Rusyns | 100.0 /100 | #12 | Exceptional 98.3% |
| Tlingit-Haida | 100.0 /100 | #13 | Exceptional 98.3% |
| Dutch | 100.0 /100 | #14 | Exceptional 98.3% |
| Scottish | 100.0 /100 | #15 | Exceptional 98.3% |
| Poles | 100.0 /100 | #16 | Exceptional 98.3% |
| Irish | 100.0 /100 | #17 | Exceptional 98.3% |
| Pennsylvania Germans | 100.0 /100 | #18 | Exceptional 98.3% |
| Finns | 100.0 /100 | #19 | Exceptional 98.2% |
| Lithuanians | 100.0 /100 | #20 | Exceptional 98.2% |
| Danes | 100.0 /100 | #21 | Exceptional 98.2% |
| Croatians | 100.0 /100 | #22 | Exceptional 98.2% |
Demographics Similar to Arapaho by 5th Grade
In terms of 5th grade, the demographic groups most similar to Arapaho are Czechoslovakian (98.0%, a difference of 0.0%), Aleut (98.0%, a difference of 0.010%), Native Hawaiian (98.0%, a difference of 0.010%), Ottawa (98.0%, a difference of 0.020%), and Bulgarian (98.0%, a difference of 0.020%).
| Demographics | Rating | Rank | 5th Grade |
| Luxembourgers | 99.9 /100 | #39 | Exceptional 98.1% |
| Eastern Europeans | 99.9 /100 | #40 | Exceptional 98.1% |
| Hungarians | 99.9 /100 | #41 | Exceptional 98.0% |
| Northern Europeans | 99.9 /100 | #42 | Exceptional 98.0% |
| Ottawa | 99.9 /100 | #43 | Exceptional 98.0% |
| Aleuts | 99.9 /100 | #44 | Exceptional 98.0% |
| Czechoslovakians | 99.9 /100 | #45 | Exceptional 98.0% |
| Arapaho | 99.9 /100 | #46 | Exceptional 98.0% |
| Native Hawaiians | 99.9 /100 | #47 | Exceptional 98.0% |
| Bulgarians | 99.8 /100 | #48 | Exceptional 98.0% |
| Estonians | 99.8 /100 | #49 | Exceptional 98.0% |
| Immigrants | Scotland | 99.8 /100 | #50 | Exceptional 98.0% |
| Celtics | 99.8 /100 | #51 | Exceptional 98.0% |
| Maltese | 99.8 /100 | #52 | Exceptional 98.0% |
| Slavs | 99.8 /100 | #53 | Exceptional 98.0% |