Scandinavian vs South American Indian 2nd Grade
COMPARE
Scandinavian
South American Indian
2nd Grade
2nd Grade Comparison
Scandinavians
South American Indians
98.5%
2ND GRADE
100.0/ 100
METRIC RATING
33rd/ 347
METRIC RANK
97.7%
2ND GRADE
6.7/ 100
METRIC RATING
216th/ 347
METRIC RANK
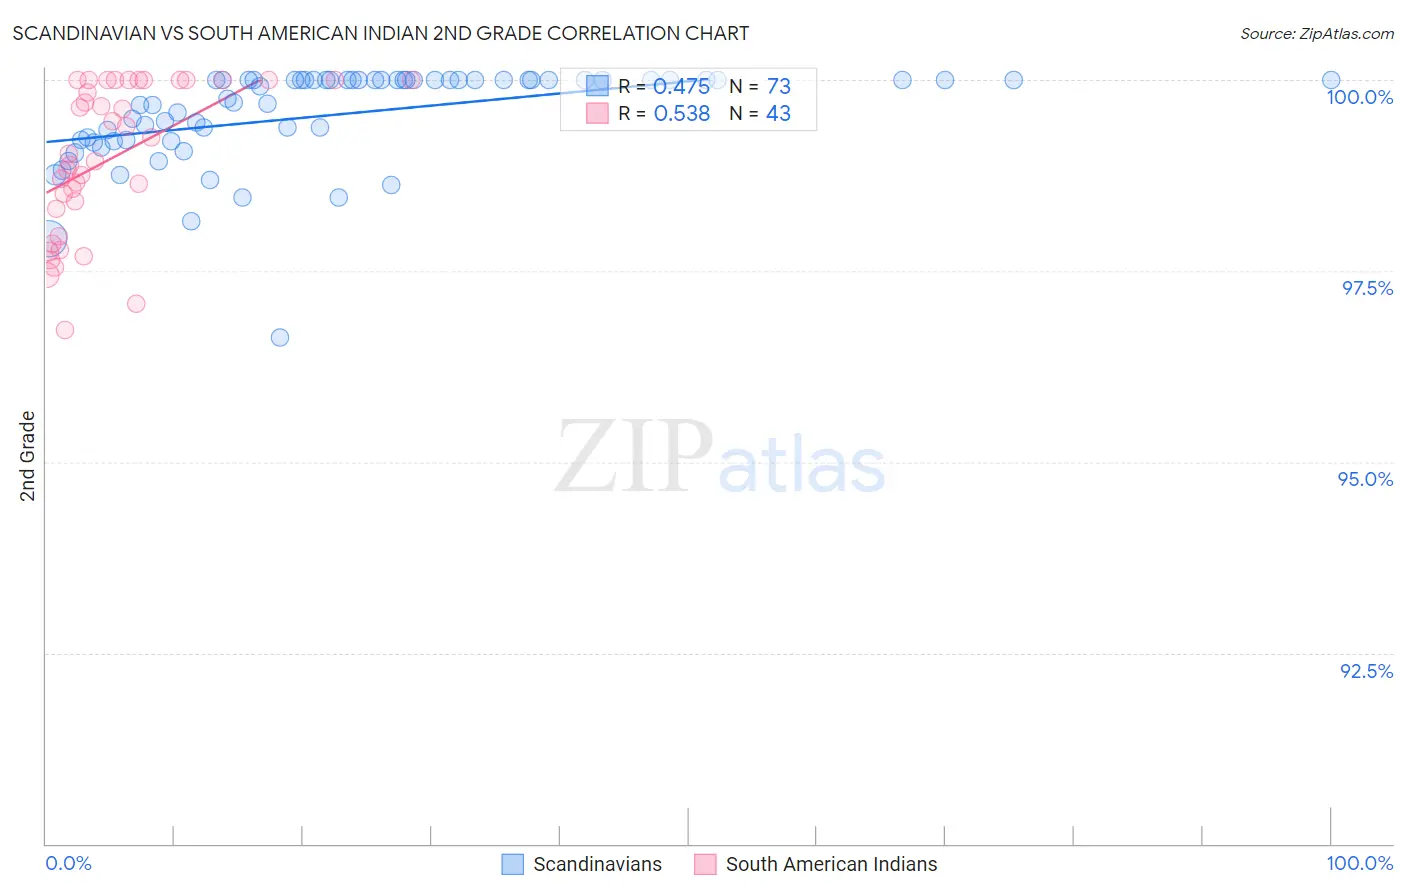
Scandinavian vs South American Indian 2nd Grade Correlation Chart
The statistical analysis conducted on geographies consisting of 472,660,430 people shows a moderate positive correlation between the proportion of Scandinavians and percentage of population with at least 2nd grade education in the United States with a correlation coefficient (R) of 0.475 and weighted average of 98.5%. Similarly, the statistical analysis conducted on geographies consisting of 164,573,401 people shows a substantial positive correlation between the proportion of South American Indians and percentage of population with at least 2nd grade education in the United States with a correlation coefficient (R) of 0.538 and weighted average of 97.7%, a difference of 0.86%.
2nd Grade Correlation Summary
| Measurement | Scandinavian | South American Indian |
| Minimum | 96.6% | 96.7% |
| Maximum | 100.0% | 100.0% |
| Range | 3.4% | 3.3% |
| Mean | 99.5% | 99.0% |
| Median | 100.0% | 99.0% |
| Interquartile 25% (IQ1) | 99.2% | 98.3% |
| Interquartile 75% (IQ3) | 100.0% | 100.0% |
| Interquartile Range (IQR) | 0.79% | 1.7% |
| Standard Deviation (Sample) | 0.63% | 0.98% |
| Standard Deviation (Population) | 0.63% | 0.96% |
Similar Demographics by 2nd Grade
Demographics Similar to Scandinavians by 2nd Grade
In terms of 2nd grade, the demographic groups most similar to Scandinavians are French Canadian (98.5%, a difference of 0.0%), French (98.5%, a difference of 0.010%), European (98.5%, a difference of 0.010%), Czech (98.5%, a difference of 0.010%), and Croatian (98.5%, a difference of 0.020%).
| Demographics | Rating | Rank | 2nd Grade |
| Welsh | 100.0 /100 | #26 | Exceptional 98.5% |
| Croatians | 100.0 /100 | #27 | Exceptional 98.5% |
| Arapaho | 100.0 /100 | #28 | Exceptional 98.5% |
| French | 100.0 /100 | #29 | Exceptional 98.5% |
| Europeans | 100.0 /100 | #30 | Exceptional 98.5% |
| Czechs | 100.0 /100 | #31 | Exceptional 98.5% |
| French Canadians | 100.0 /100 | #32 | Exceptional 98.5% |
| Scandinavians | 100.0 /100 | #33 | Exceptional 98.5% |
| Chinese | 100.0 /100 | #34 | Exceptional 98.5% |
| Swiss | 100.0 /100 | #35 | Exceptional 98.5% |
| British | 100.0 /100 | #36 | Exceptional 98.5% |
| Italians | 99.9 /100 | #37 | Exceptional 98.4% |
| Latvians | 99.9 /100 | #38 | Exceptional 98.4% |
| Chippewa | 99.9 /100 | #39 | Exceptional 98.4% |
| Luxembourgers | 99.9 /100 | #40 | Exceptional 98.4% |
Demographics Similar to South American Indians by 2nd Grade
In terms of 2nd grade, the demographic groups most similar to South American Indians are Bahamian (97.7%, a difference of 0.0%), Samoan (97.7%, a difference of 0.010%), Uruguayan (97.7%, a difference of 0.010%), Sudanese (97.7%, a difference of 0.010%), and Immigrants from Bahamas (97.7%, a difference of 0.020%).
| Demographics | Rating | Rank | 2nd Grade |
| Immigrants | Oceania | 10.9 /100 | #209 | Poor 97.7% |
| Costa Ricans | 10.5 /100 | #210 | Poor 97.7% |
| Laotians | 9.9 /100 | #211 | Tragic 97.7% |
| Immigrants | Bahamas | 8.4 /100 | #212 | Tragic 97.7% |
| Moroccans | 8.2 /100 | #213 | Tragic 97.7% |
| Samoans | 7.1 /100 | #214 | Tragic 97.7% |
| Bahamians | 6.8 /100 | #215 | Tragic 97.7% |
| South American Indians | 6.7 /100 | #216 | Tragic 97.7% |
| Uruguayans | 6.2 /100 | #217 | Tragic 97.7% |
| Sudanese | 5.7 /100 | #218 | Tragic 97.7% |
| Immigrants | Panama | 5.1 /100 | #219 | Tragic 97.6% |
| Immigrants | Morocco | 5.0 /100 | #220 | Tragic 97.6% |
| Iraqis | 4.6 /100 | #221 | Tragic 97.6% |
| Immigrants | Sudan | 4.5 /100 | #222 | Tragic 97.6% |
| Sierra Leoneans | 4.3 /100 | #223 | Tragic 97.6% |