Immigrants from Indonesia vs Navajo 1st Grade
COMPARE
Immigrants from Indonesia
Navajo
1st Grade
1st Grade Comparison
Immigrants from Indonesia
Navajo
97.6%
1ST GRADE
1.2/ 100
METRIC RATING
242nd/ 347
METRIC RANK
97.9%
1ST GRADE
56.6/ 100
METRIC RATING
166th/ 347
METRIC RANK
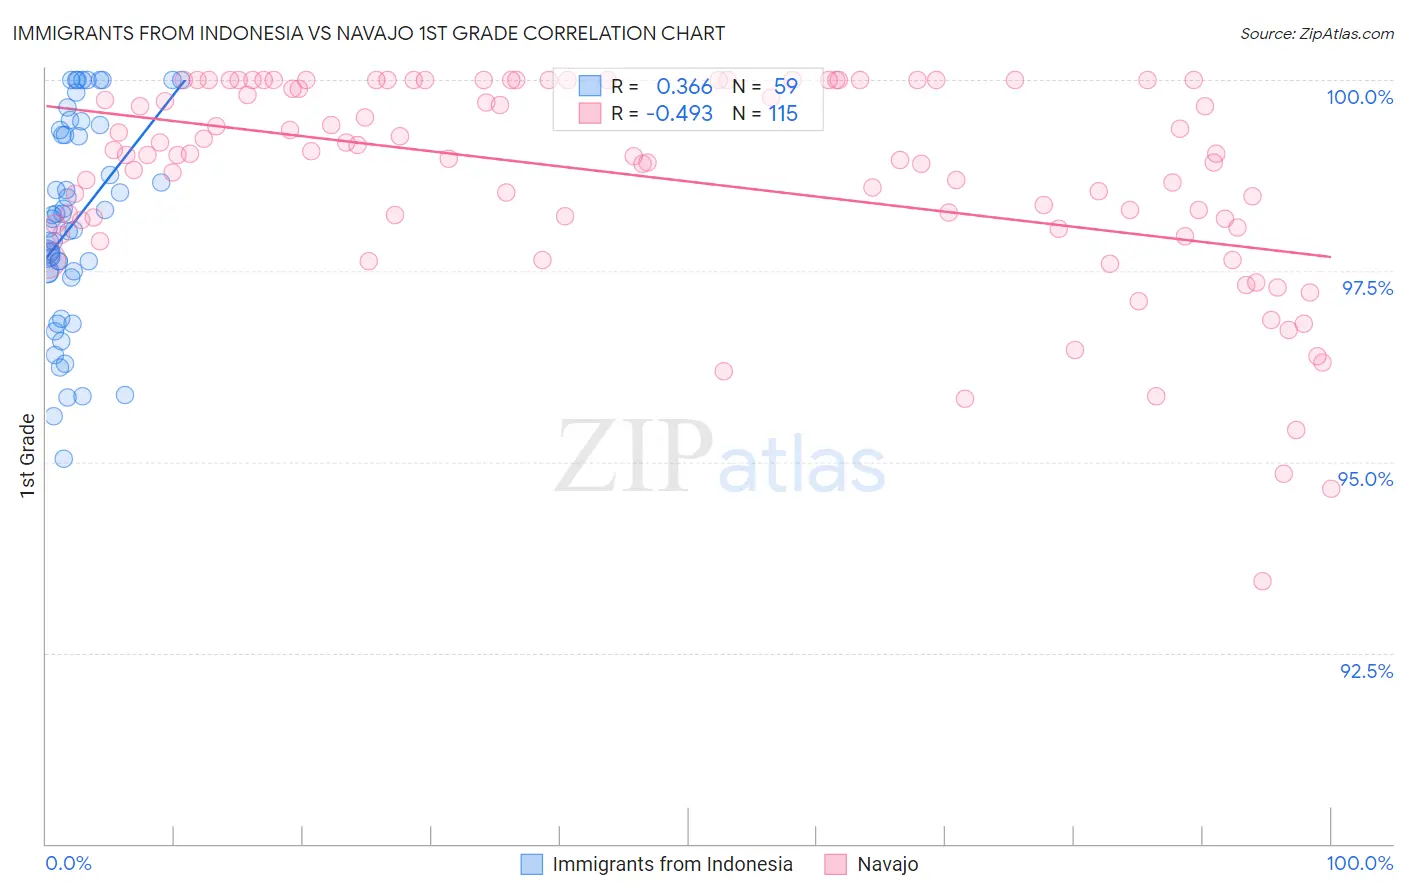
Immigrants from Indonesia vs Navajo 1st Grade Correlation Chart
The statistical analysis conducted on geographies consisting of 215,782,971 people shows a mild positive correlation between the proportion of Immigrants from Indonesia and percentage of population with at least 1st grade education in the United States with a correlation coefficient (R) of 0.366 and weighted average of 97.6%. Similarly, the statistical analysis conducted on geographies consisting of 224,872,493 people shows a moderate negative correlation between the proportion of Navajo and percentage of population with at least 1st grade education in the United States with a correlation coefficient (R) of -0.493 and weighted average of 97.9%, a difference of 0.36%.
1st Grade Correlation Summary
| Measurement | Immigrants from Indonesia | Navajo |
| Minimum | 95.0% | 93.4% |
| Maximum | 100.0% | 100.0% |
| Range | 5.0% | 6.6% |
| Mean | 98.1% | 98.7% |
| Median | 98.2% | 99.0% |
| Interquartile 25% (IQ1) | 97.5% | 98.1% |
| Interquartile 75% (IQ3) | 99.3% | 100.0% |
| Interquartile Range (IQR) | 1.9% | 1.9% |
| Standard Deviation (Sample) | 1.3% | 1.4% |
| Standard Deviation (Population) | 1.3% | 1.3% |
Similar Demographics by 1st Grade
Demographics Similar to Immigrants from Indonesia by 1st Grade
In terms of 1st grade, the demographic groups most similar to Immigrants from Indonesia are Bolivian (97.6%, a difference of 0.0%), Liberian (97.6%, a difference of 0.010%), Asian (97.6%, a difference of 0.010%), South American (97.6%, a difference of 0.010%), and Immigrants from Eastern Africa (97.6%, a difference of 0.010%).
| Demographics | Rating | Rank | 1st Grade |
| Immigrants | Malaysia | 2.1 /100 | #235 | Tragic 97.6% |
| Immigrants | Western Asia | 2.1 /100 | #236 | Tragic 97.6% |
| U.S. Virgin Islanders | 1.9 /100 | #237 | Tragic 97.6% |
| Nigerians | 1.8 /100 | #238 | Tragic 97.6% |
| Immigrants | Eastern Asia | 1.6 /100 | #239 | Tragic 97.6% |
| Koreans | 1.5 /100 | #240 | Tragic 97.6% |
| Liberians | 1.4 /100 | #241 | Tragic 97.6% |
| Immigrants | Indonesia | 1.2 /100 | #242 | Tragic 97.6% |
| Bolivians | 1.2 /100 | #243 | Tragic 97.6% |
| Asians | 1.1 /100 | #244 | Tragic 97.6% |
| South Americans | 1.1 /100 | #245 | Tragic 97.6% |
| Immigrants | Eastern Africa | 1.0 /100 | #246 | Tragic 97.6% |
| Peruvians | 1.0 /100 | #247 | Tragic 97.6% |
| Immigrants | Middle Africa | 1.0 /100 | #248 | Tragic 97.6% |
| Immigrants | Senegal | 1.0 /100 | #249 | Tragic 97.6% |
Demographics Similar to Navajo by 1st Grade
In terms of 1st grade, the demographic groups most similar to Navajo are Spanish American (97.9%, a difference of 0.0%), Brazilian (97.9%, a difference of 0.0%), Ugandan (97.9%, a difference of 0.0%), Bermudan (97.9%, a difference of 0.0%), and Chilean (97.9%, a difference of 0.0%).
| Demographics | Rating | Rank | 1st Grade |
| French American Indians | 63.7 /100 | #159 | Good 98.0% |
| Immigrants | Russia | 59.2 /100 | #160 | Average 97.9% |
| Immigrants | Italy | 59.1 /100 | #161 | Average 97.9% |
| Immigrants | Eastern Europe | 58.9 /100 | #162 | Average 97.9% |
| Spanish Americans | 57.7 /100 | #163 | Average 97.9% |
| Brazilians | 57.6 /100 | #164 | Average 97.9% |
| Ugandans | 56.9 /100 | #165 | Average 97.9% |
| Navajo | 56.6 /100 | #166 | Average 97.9% |
| Bermudans | 56.3 /100 | #167 | Average 97.9% |
| Chileans | 55.6 /100 | #168 | Average 97.9% |
| Immigrants | Micronesia | 55.3 /100 | #169 | Average 97.9% |
| Immigrants | Spain | 54.9 /100 | #170 | Average 97.9% |
| Immigrants | Jordan | 53.9 /100 | #171 | Average 97.9% |
| Immigrants | Korea | 53.0 /100 | #172 | Average 97.9% |
| Kenyans | 51.2 /100 | #173 | Average 97.9% |