Lithuanian vs Navajo 1st Grade
COMPARE
Lithuanian
Navajo
1st Grade
1st Grade Comparison
Lithuanians
Navajo
98.6%
1ST GRADE
100.0/ 100
METRIC RATING
24th/ 347
METRIC RANK
97.9%
1ST GRADE
56.6/ 100
METRIC RATING
166th/ 347
METRIC RANK
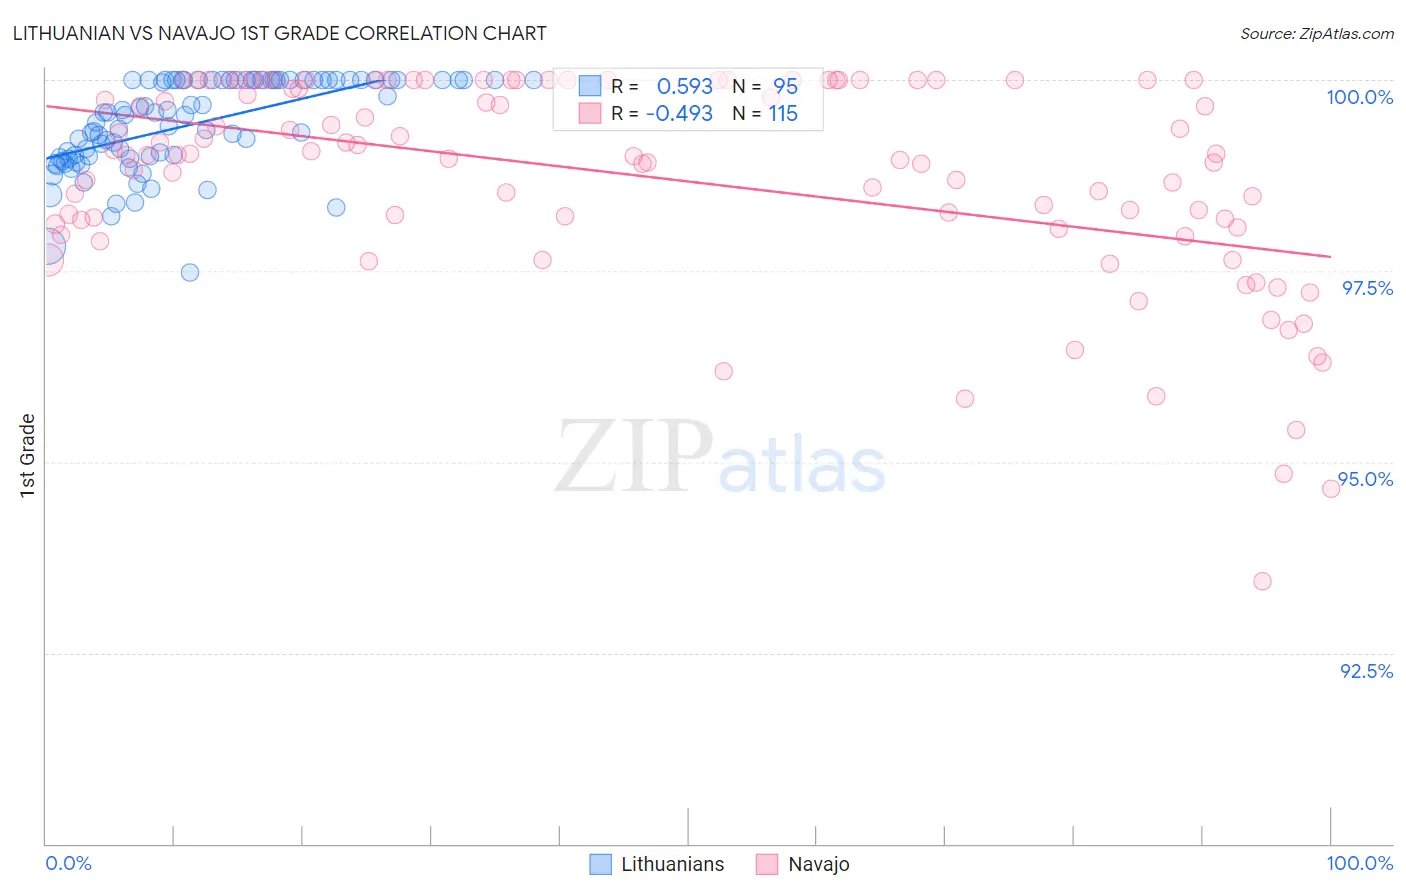
Lithuanian vs Navajo 1st Grade Correlation Chart
The statistical analysis conducted on geographies consisting of 421,946,231 people shows a substantial positive correlation between the proportion of Lithuanians and percentage of population with at least 1st grade education in the United States with a correlation coefficient (R) of 0.593 and weighted average of 98.6%. Similarly, the statistical analysis conducted on geographies consisting of 224,872,493 people shows a moderate negative correlation between the proportion of Navajo and percentage of population with at least 1st grade education in the United States with a correlation coefficient (R) of -0.493 and weighted average of 97.9%, a difference of 0.65%.
1st Grade Correlation Summary
| Measurement | Lithuanian | Navajo |
| Minimum | 97.5% | 93.4% |
| Maximum | 100.0% | 100.0% |
| Range | 2.5% | 6.6% |
| Mean | 99.4% | 98.7% |
| Median | 99.5% | 99.0% |
| Interquartile 25% (IQ1) | 99.0% | 98.1% |
| Interquartile 75% (IQ3) | 100.0% | 100.0% |
| Interquartile Range (IQR) | 1.0% | 1.9% |
| Standard Deviation (Sample) | 0.59% | 1.4% |
| Standard Deviation (Population) | 0.59% | 1.3% |
Similar Demographics by 1st Grade
Demographics Similar to Lithuanians by 1st Grade
In terms of 1st grade, the demographic groups most similar to Lithuanians are Sioux (98.6%, a difference of 0.0%), Arapaho (98.6%, a difference of 0.0%), Pennsylvania German (98.6%, a difference of 0.0%), Finnish (98.6%, a difference of 0.0%), and Danish (98.6%, a difference of 0.0%).
| Demographics | Rating | Rank | 1st Grade |
| Scottish | 100.0 /100 | #17 | Exceptional 98.6% |
| Dutch | 100.0 /100 | #18 | Exceptional 98.6% |
| Irish | 100.0 /100 | #19 | Exceptional 98.6% |
| Sioux | 100.0 /100 | #20 | Exceptional 98.6% |
| Arapaho | 100.0 /100 | #21 | Exceptional 98.6% |
| Pennsylvania Germans | 100.0 /100 | #22 | Exceptional 98.6% |
| Finns | 100.0 /100 | #23 | Exceptional 98.6% |
| Lithuanians | 100.0 /100 | #24 | Exceptional 98.6% |
| Danes | 100.0 /100 | #25 | Exceptional 98.6% |
| Scotch-Irish | 100.0 /100 | #26 | Exceptional 98.6% |
| Poles | 100.0 /100 | #27 | Exceptional 98.6% |
| Croatians | 100.0 /100 | #28 | Exceptional 98.6% |
| French | 100.0 /100 | #29 | Exceptional 98.6% |
| Europeans | 100.0 /100 | #30 | Exceptional 98.5% |
| Czechs | 100.0 /100 | #31 | Exceptional 98.5% |
Demographics Similar to Navajo by 1st Grade
In terms of 1st grade, the demographic groups most similar to Navajo are Spanish American (97.9%, a difference of 0.0%), Brazilian (97.9%, a difference of 0.0%), Ugandan (97.9%, a difference of 0.0%), Bermudan (97.9%, a difference of 0.0%), and Chilean (97.9%, a difference of 0.0%).
| Demographics | Rating | Rank | 1st Grade |
| French American Indians | 63.7 /100 | #159 | Good 98.0% |
| Immigrants | Russia | 59.2 /100 | #160 | Average 97.9% |
| Immigrants | Italy | 59.1 /100 | #161 | Average 97.9% |
| Immigrants | Eastern Europe | 58.9 /100 | #162 | Average 97.9% |
| Spanish Americans | 57.7 /100 | #163 | Average 97.9% |
| Brazilians | 57.6 /100 | #164 | Average 97.9% |
| Ugandans | 56.9 /100 | #165 | Average 97.9% |
| Navajo | 56.6 /100 | #166 | Average 97.9% |
| Bermudans | 56.3 /100 | #167 | Average 97.9% |
| Chileans | 55.6 /100 | #168 | Average 97.9% |
| Immigrants | Micronesia | 55.3 /100 | #169 | Average 97.9% |
| Immigrants | Spain | 54.9 /100 | #170 | Average 97.9% |
| Immigrants | Jordan | 53.9 /100 | #171 | Average 97.9% |
| Immigrants | Korea | 53.0 /100 | #172 | Average 97.9% |
| Kenyans | 51.2 /100 | #173 | Average 97.9% |