Zimbabwean vs Immigrants from Belarus 4th Grade
COMPARE
Zimbabwean
Immigrants from Belarus
4th Grade
4th Grade Comparison
Zimbabweans
Immigrants from Belarus
97.9%
4TH GRADE
98.8/ 100
METRIC RATING
87th/ 347
METRIC RANK
97.5%
4TH GRADE
55.8/ 100
METRIC RATING
168th/ 347
METRIC RANK
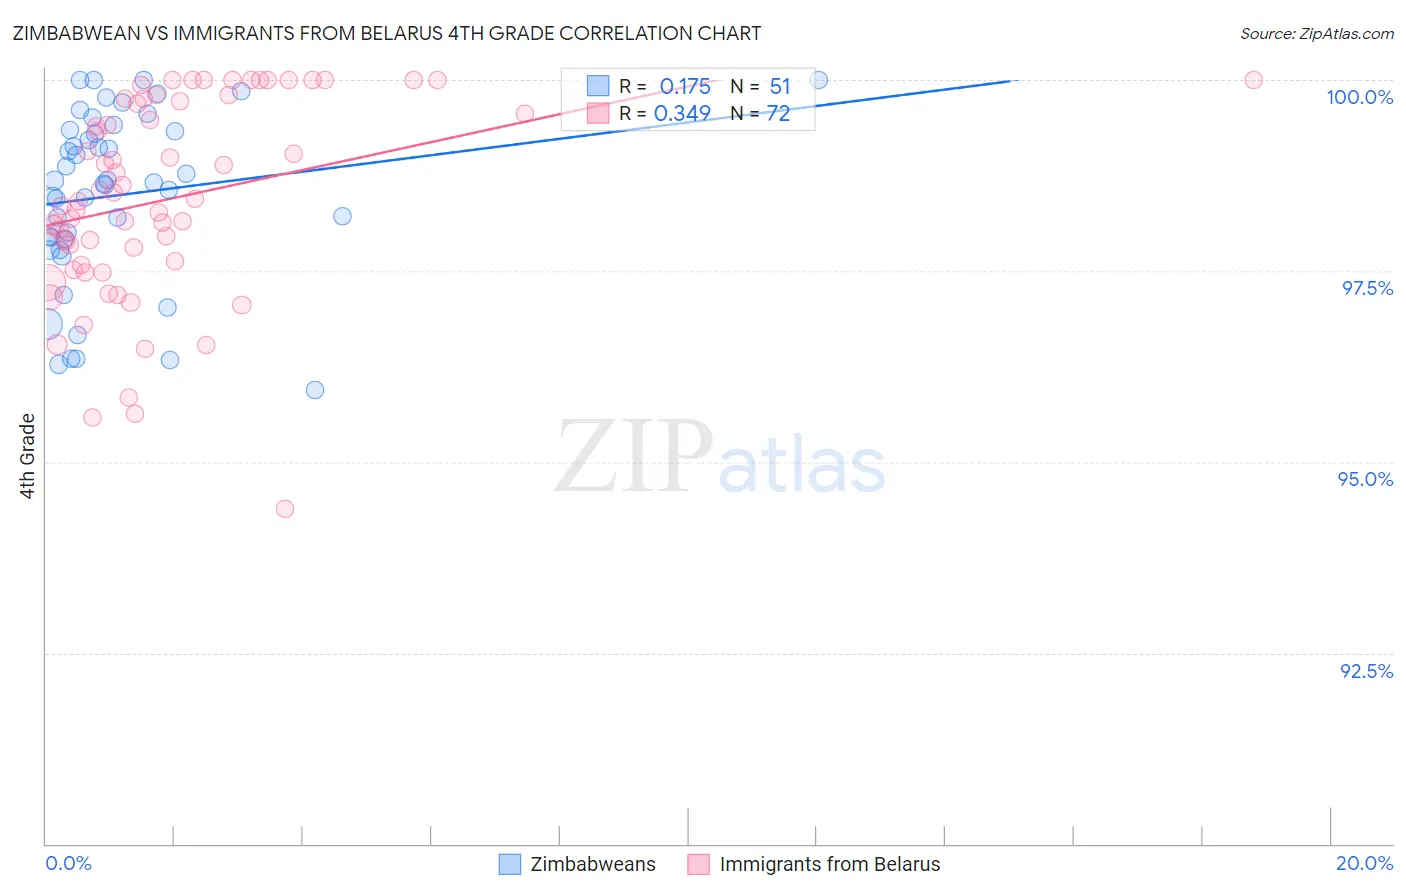
Zimbabwean vs Immigrants from Belarus 4th Grade Correlation Chart
The statistical analysis conducted on geographies consisting of 69,203,423 people shows a poor positive correlation between the proportion of Zimbabweans and percentage of population with at least 4th grade education in the United States with a correlation coefficient (R) of 0.175 and weighted average of 97.9%. Similarly, the statistical analysis conducted on geographies consisting of 149,993,317 people shows a mild positive correlation between the proportion of Immigrants from Belarus and percentage of population with at least 4th grade education in the United States with a correlation coefficient (R) of 0.349 and weighted average of 97.5%, a difference of 0.39%.
4th Grade Correlation Summary
| Measurement | Zimbabwean | Immigrants from Belarus |
| Minimum | 95.9% | 94.4% |
| Maximum | 100.0% | 100.0% |
| Range | 4.1% | 5.6% |
| Mean | 98.5% | 98.5% |
| Median | 98.7% | 98.4% |
| Interquartile 25% (IQ1) | 97.9% | 97.6% |
| Interquartile 75% (IQ3) | 99.3% | 99.7% |
| Interquartile Range (IQR) | 1.4% | 2.1% |
| Standard Deviation (Sample) | 1.1% | 1.3% |
| Standard Deviation (Population) | 1.1% | 1.3% |
Similar Demographics by 4th Grade
Demographics Similar to Zimbabweans by 4th Grade
In terms of 4th grade, the demographic groups most similar to Zimbabweans are Immigrants from Australia (97.9%, a difference of 0.0%), Immigrants from South Africa (97.9%, a difference of 0.0%), Delaware (97.9%, a difference of 0.0%), Immigrants from Denmark (97.9%, a difference of 0.0%), and Immigrants from Sweden (97.9%, a difference of 0.0%).
| Demographics | Rating | Rank | 4th Grade |
| Osage | 99.2 /100 | #80 | Exceptional 98.0% |
| Immigrants | India | 99.1 /100 | #81 | Exceptional 98.0% |
| Icelanders | 99.1 /100 | #82 | Exceptional 98.0% |
| Immigrants | Belgium | 99.0 /100 | #83 | Exceptional 97.9% |
| Cypriots | 98.9 /100 | #84 | Exceptional 97.9% |
| Potawatomi | 98.9 /100 | #85 | Exceptional 97.9% |
| Immigrants | Australia | 98.8 /100 | #86 | Exceptional 97.9% |
| Zimbabweans | 98.8 /100 | #87 | Exceptional 97.9% |
| Immigrants | South Africa | 98.8 /100 | #88 | Exceptional 97.9% |
| Delaware | 98.8 /100 | #89 | Exceptional 97.9% |
| Immigrants | Denmark | 98.7 /100 | #90 | Exceptional 97.9% |
| Immigrants | Sweden | 98.7 /100 | #91 | Exceptional 97.9% |
| Immigrants | Western Europe | 98.7 /100 | #92 | Exceptional 97.9% |
| Immigrants | Ireland | 98.7 /100 | #93 | Exceptional 97.9% |
| Shoshone | 98.7 /100 | #94 | Exceptional 97.9% |
Demographics Similar to Immigrants from Belarus by 4th Grade
In terms of 4th grade, the demographic groups most similar to Immigrants from Belarus are Kenyan (97.5%, a difference of 0.0%), Immigrants from Poland (97.5%, a difference of 0.0%), Ugandan (97.6%, a difference of 0.010%), Venezuelan (97.6%, a difference of 0.010%), and Chilean (97.5%, a difference of 0.010%).
| Demographics | Rating | Rank | 4th Grade |
| Marshallese | 60.8 /100 | #161 | Good 97.6% |
| Bermudans | 60.5 /100 | #162 | Good 97.6% |
| Immigrants | Iran | 60.3 /100 | #163 | Good 97.6% |
| Ugandans | 58.9 /100 | #164 | Average 97.6% |
| Venezuelans | 58.7 /100 | #165 | Average 97.6% |
| Kenyans | 56.5 /100 | #166 | Average 97.5% |
| Immigrants | Poland | 55.9 /100 | #167 | Average 97.5% |
| Immigrants | Belarus | 55.8 /100 | #168 | Average 97.5% |
| Chileans | 54.4 /100 | #169 | Average 97.5% |
| Immigrants | Spain | 51.8 /100 | #170 | Average 97.5% |
| Brazilians | 51.5 /100 | #171 | Average 97.5% |
| Immigrants | Sri Lanka | 51.1 /100 | #172 | Average 97.5% |
| Immigrants | Korea | 50.6 /100 | #173 | Average 97.5% |
| Egyptians | 50.0 /100 | #174 | Average 97.5% |
| Immigrants | Micronesia | 49.6 /100 | #175 | Average 97.5% |