Russian vs Immigrants from Morocco 4th Grade
COMPARE
Russian
Immigrants from Morocco
4th Grade
4th Grade Comparison
Russians
Immigrants from Morocco
98.0%
4TH GRADE
99.7/ 100
METRIC RATING
63rd/ 347
METRIC RANK
97.3%
4TH GRADE
7.1/ 100
METRIC RATING
215th/ 347
METRIC RANK
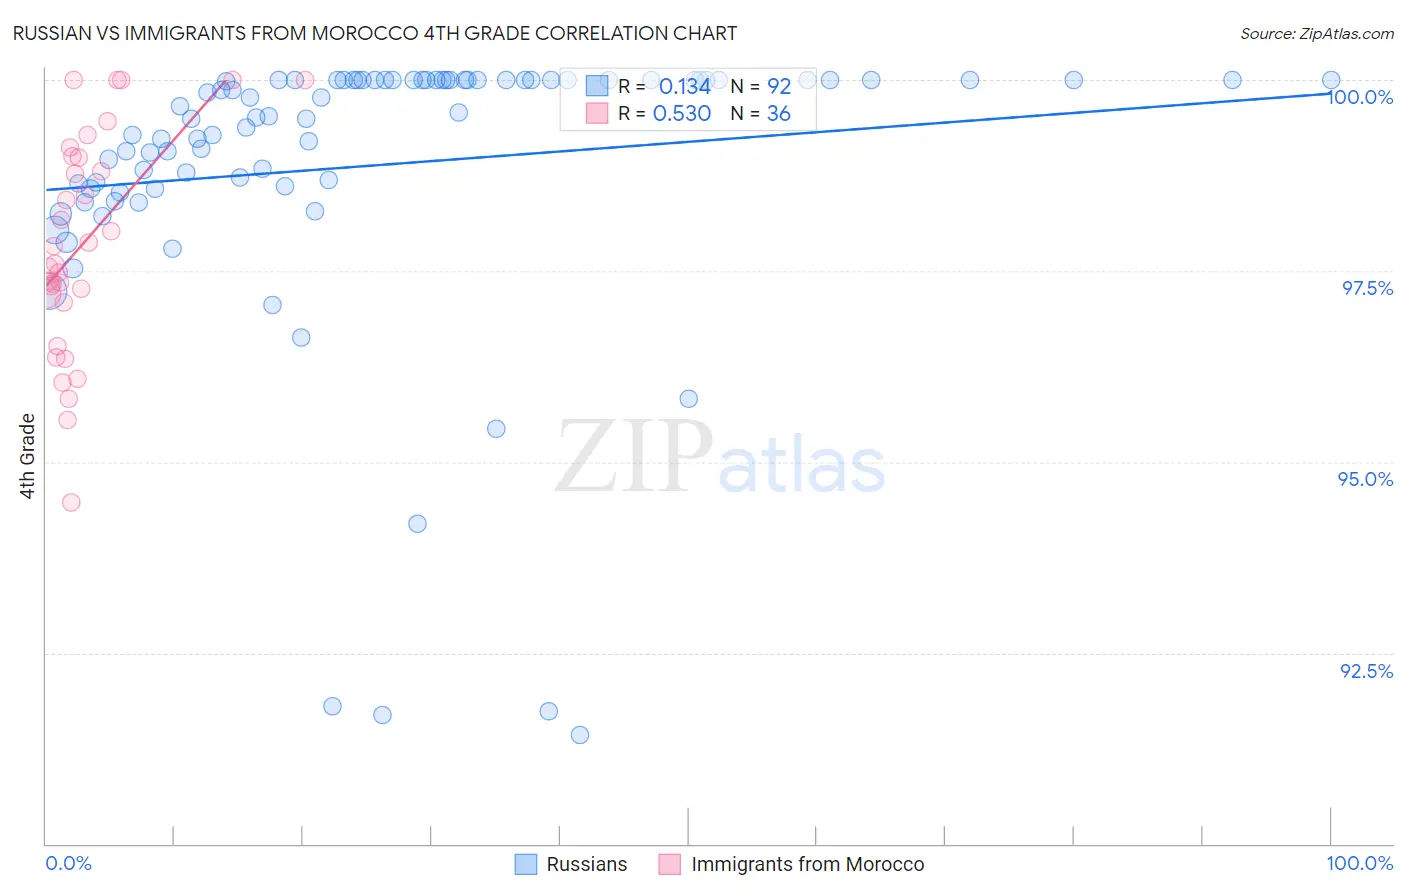
Russian vs Immigrants from Morocco 4th Grade Correlation Chart
The statistical analysis conducted on geographies consisting of 512,259,139 people shows a poor positive correlation between the proportion of Russians and percentage of population with at least 4th grade education in the United States with a correlation coefficient (R) of 0.134 and weighted average of 98.0%. Similarly, the statistical analysis conducted on geographies consisting of 178,910,634 people shows a substantial positive correlation between the proportion of Immigrants from Morocco and percentage of population with at least 4th grade education in the United States with a correlation coefficient (R) of 0.530 and weighted average of 97.3%, a difference of 0.79%.
4th Grade Correlation Summary
| Measurement | Russian | Immigrants from Morocco |
| Minimum | 91.4% | 94.5% |
| Maximum | 100.0% | 100.0% |
| Range | 8.6% | 5.5% |
| Mean | 98.9% | 97.9% |
| Median | 99.5% | 97.7% |
| Interquartile 25% (IQ1) | 98.6% | 97.1% |
| Interquartile 75% (IQ3) | 100.0% | 99.0% |
| Interquartile Range (IQR) | 1.4% | 1.8% |
| Standard Deviation (Sample) | 1.9% | 1.4% |
| Standard Deviation (Population) | 1.9% | 1.4% |
Similar Demographics by 4th Grade
Demographics Similar to Russians by 4th Grade
In terms of 4th grade, the demographic groups most similar to Russians are Immigrants from Canada (98.1%, a difference of 0.010%), Immigrants from North America (98.1%, a difference of 0.010%), Serbian (98.1%, a difference of 0.010%), Cajun (98.0%, a difference of 0.010%), and Immigrants from Northern Europe (98.0%, a difference of 0.010%).
| Demographics | Rating | Rank | 4th Grade |
| Greeks | 99.8 /100 | #56 | Exceptional 98.1% |
| Austrians | 99.8 /100 | #57 | Exceptional 98.1% |
| Creek | 99.8 /100 | #58 | Exceptional 98.1% |
| Americans | 99.8 /100 | #59 | Exceptional 98.1% |
| Immigrants | Canada | 99.7 /100 | #60 | Exceptional 98.1% |
| Immigrants | North America | 99.7 /100 | #61 | Exceptional 98.1% |
| Serbians | 99.7 /100 | #62 | Exceptional 98.1% |
| Russians | 99.7 /100 | #63 | Exceptional 98.0% |
| Cajuns | 99.7 /100 | #64 | Exceptional 98.0% |
| Immigrants | Northern Europe | 99.6 /100 | #65 | Exceptional 98.0% |
| Canadians | 99.6 /100 | #66 | Exceptional 98.0% |
| New Zealanders | 99.6 /100 | #67 | Exceptional 98.0% |
| Kiowa | 99.6 /100 | #68 | Exceptional 98.0% |
| Pueblo | 99.6 /100 | #69 | Exceptional 98.0% |
| Immigrants | Austria | 99.6 /100 | #70 | Exceptional 98.0% |
Demographics Similar to Immigrants from Morocco by 4th Grade
In terms of 4th grade, the demographic groups most similar to Immigrants from Morocco are Samoan (97.3%, a difference of 0.0%), Immigrants from Nepal (97.3%, a difference of 0.010%), Sierra Leonean (97.3%, a difference of 0.010%), Iraqi (97.3%, a difference of 0.010%), and Tohono O'odham (97.3%, a difference of 0.020%).
| Demographics | Rating | Rank | 4th Grade |
| Immigrants | Bahamas | 10.8 /100 | #208 | Poor 97.3% |
| Laotians | 9.3 /100 | #209 | Tragic 97.3% |
| Immigrants | Oceania | 9.1 /100 | #210 | Tragic 97.3% |
| Sudanese | 9.0 /100 | #211 | Tragic 97.3% |
| Tohono O'odham | 8.4 /100 | #212 | Tragic 97.3% |
| Costa Ricans | 8.3 /100 | #213 | Tragic 97.3% |
| Immigrants | Nepal | 7.7 /100 | #214 | Tragic 97.3% |
| Immigrants | Morocco | 7.1 /100 | #215 | Tragic 97.3% |
| Samoans | 6.8 /100 | #216 | Tragic 97.3% |
| Sierra Leoneans | 6.5 /100 | #217 | Tragic 97.3% |
| Iraqis | 6.3 /100 | #218 | Tragic 97.3% |
| Tongans | 5.8 /100 | #219 | Tragic 97.3% |
| South American Indians | 5.5 /100 | #220 | Tragic 97.3% |
| Immigrants | Panama | 5.4 /100 | #221 | Tragic 97.3% |
| Immigrants | Lebanon | 5.1 /100 | #222 | Tragic 97.3% |