Russian vs Immigrants from Colombia 4th Grade
COMPARE
Russian
Immigrants from Colombia
4th Grade
4th Grade Comparison
Russians
Immigrants from Colombia
98.0%
4TH GRADE
99.7/ 100
METRIC RATING
63rd/ 347
METRIC RANK
97.0%
4TH GRADE
0.5/ 100
METRIC RATING
258th/ 347
METRIC RANK
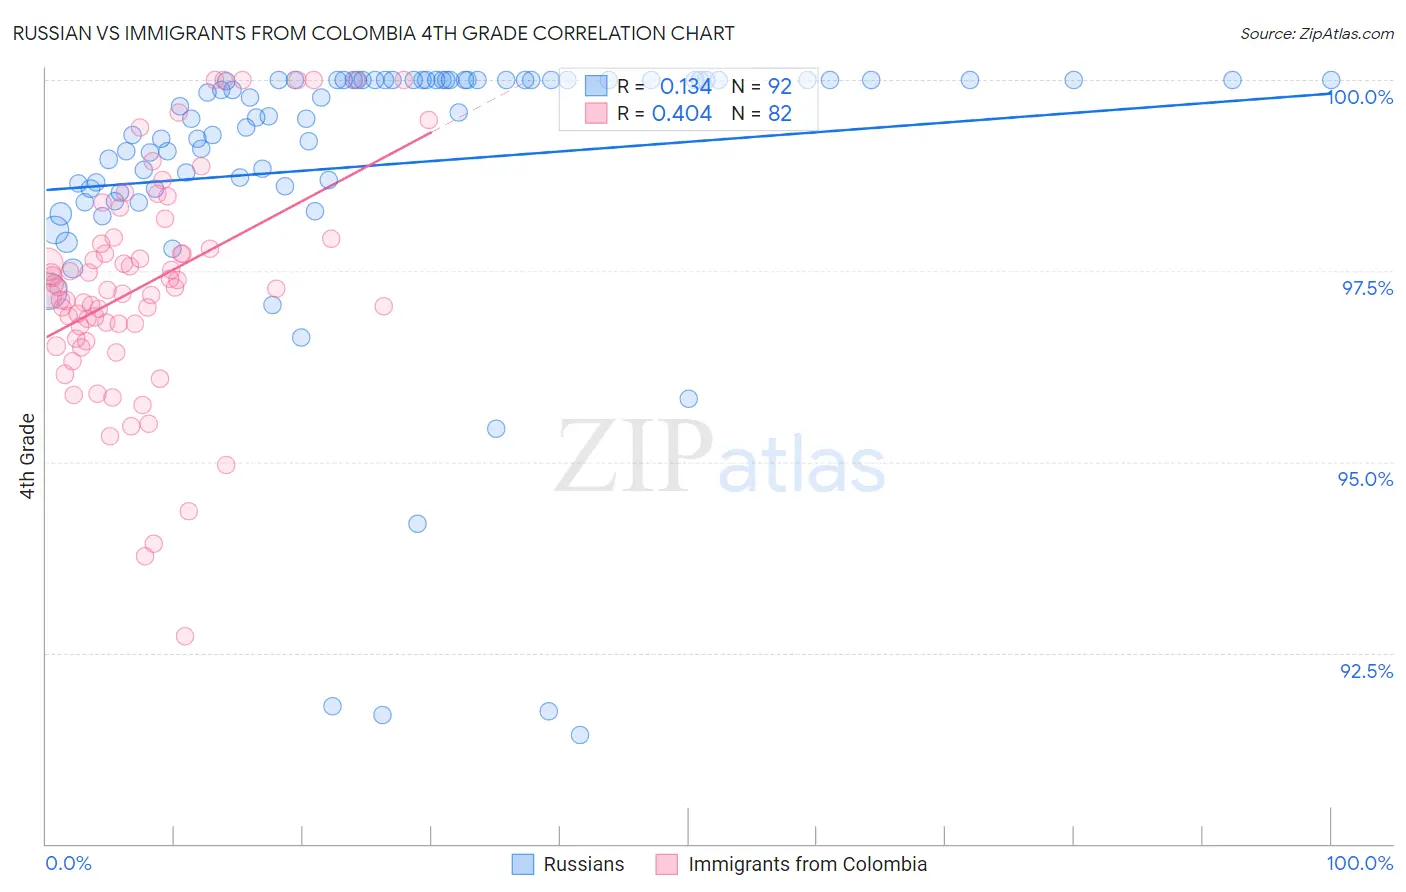
Russian vs Immigrants from Colombia 4th Grade Correlation Chart
The statistical analysis conducted on geographies consisting of 512,259,139 people shows a poor positive correlation between the proportion of Russians and percentage of population with at least 4th grade education in the United States with a correlation coefficient (R) of 0.134 and weighted average of 98.0%. Similarly, the statistical analysis conducted on geographies consisting of 378,643,693 people shows a moderate positive correlation between the proportion of Immigrants from Colombia and percentage of population with at least 4th grade education in the United States with a correlation coefficient (R) of 0.404 and weighted average of 97.0%, a difference of 1.1%.
4th Grade Correlation Summary
| Measurement | Russian | Immigrants from Colombia |
| Minimum | 91.4% | 92.7% |
| Maximum | 100.0% | 100.0% |
| Range | 8.6% | 7.3% |
| Mean | 98.9% | 97.3% |
| Median | 99.5% | 97.3% |
| Interquartile 25% (IQ1) | 98.6% | 96.8% |
| Interquartile 75% (IQ3) | 100.0% | 97.9% |
| Interquartile Range (IQR) | 1.4% | 1.1% |
| Standard Deviation (Sample) | 1.9% | 1.4% |
| Standard Deviation (Population) | 1.9% | 1.4% |
Similar Demographics by 4th Grade
Demographics Similar to Russians by 4th Grade
In terms of 4th grade, the demographic groups most similar to Russians are Immigrants from Canada (98.1%, a difference of 0.010%), Immigrants from North America (98.1%, a difference of 0.010%), Serbian (98.1%, a difference of 0.010%), Cajun (98.0%, a difference of 0.010%), and Immigrants from Northern Europe (98.0%, a difference of 0.010%).
| Demographics | Rating | Rank | 4th Grade |
| Greeks | 99.8 /100 | #56 | Exceptional 98.1% |
| Austrians | 99.8 /100 | #57 | Exceptional 98.1% |
| Creek | 99.8 /100 | #58 | Exceptional 98.1% |
| Americans | 99.8 /100 | #59 | Exceptional 98.1% |
| Immigrants | Canada | 99.7 /100 | #60 | Exceptional 98.1% |
| Immigrants | North America | 99.7 /100 | #61 | Exceptional 98.1% |
| Serbians | 99.7 /100 | #62 | Exceptional 98.1% |
| Russians | 99.7 /100 | #63 | Exceptional 98.0% |
| Cajuns | 99.7 /100 | #64 | Exceptional 98.0% |
| Immigrants | Northern Europe | 99.6 /100 | #65 | Exceptional 98.0% |
| Canadians | 99.6 /100 | #66 | Exceptional 98.0% |
| New Zealanders | 99.6 /100 | #67 | Exceptional 98.0% |
| Kiowa | 99.6 /100 | #68 | Exceptional 98.0% |
| Pueblo | 99.6 /100 | #69 | Exceptional 98.0% |
| Immigrants | Austria | 99.6 /100 | #70 | Exceptional 98.0% |
Demographics Similar to Immigrants from Colombia by 4th Grade
In terms of 4th grade, the demographic groups most similar to Immigrants from Colombia are Immigrants from Congo (97.0%, a difference of 0.0%), Immigrants from Ethiopia (97.0%, a difference of 0.010%), Immigrants from Sierra Leone (97.0%, a difference of 0.020%), Immigrants from South America (97.0%, a difference of 0.020%), and West Indian (97.0%, a difference of 0.030%).
| Demographics | Rating | Rank | 4th Grade |
| South Americans | 0.8 /100 | #251 | Tragic 97.1% |
| Jamaicans | 0.8 /100 | #252 | Tragic 97.1% |
| Immigrants | Liberia | 0.8 /100 | #253 | Tragic 97.1% |
| Immigrants | Middle Africa | 0.8 /100 | #254 | Tragic 97.1% |
| Peruvians | 0.7 /100 | #255 | Tragic 97.1% |
| Bolivians | 0.7 /100 | #256 | Tragic 97.1% |
| Immigrants | Congo | 0.5 /100 | #257 | Tragic 97.0% |
| Immigrants | Colombia | 0.5 /100 | #258 | Tragic 97.0% |
| Immigrants | Ethiopia | 0.4 /100 | #259 | Tragic 97.0% |
| Immigrants | Sierra Leone | 0.4 /100 | #260 | Tragic 97.0% |
| Immigrants | South America | 0.4 /100 | #261 | Tragic 97.0% |
| West Indians | 0.4 /100 | #262 | Tragic 97.0% |
| Immigrants | Jamaica | 0.3 /100 | #263 | Tragic 97.0% |
| Taiwanese | 0.3 /100 | #264 | Tragic 97.0% |
| Armenians | 0.3 /100 | #265 | Tragic 97.0% |