Russian vs Immigrants from Moldova 4th Grade
COMPARE
Russian
Immigrants from Moldova
4th Grade
4th Grade Comparison
Russians
Immigrants from Moldova
98.0%
4TH GRADE
99.7/ 100
METRIC RATING
63rd/ 347
METRIC RANK
97.7%
4TH GRADE
82.4/ 100
METRIC RATING
145th/ 347
METRIC RANK
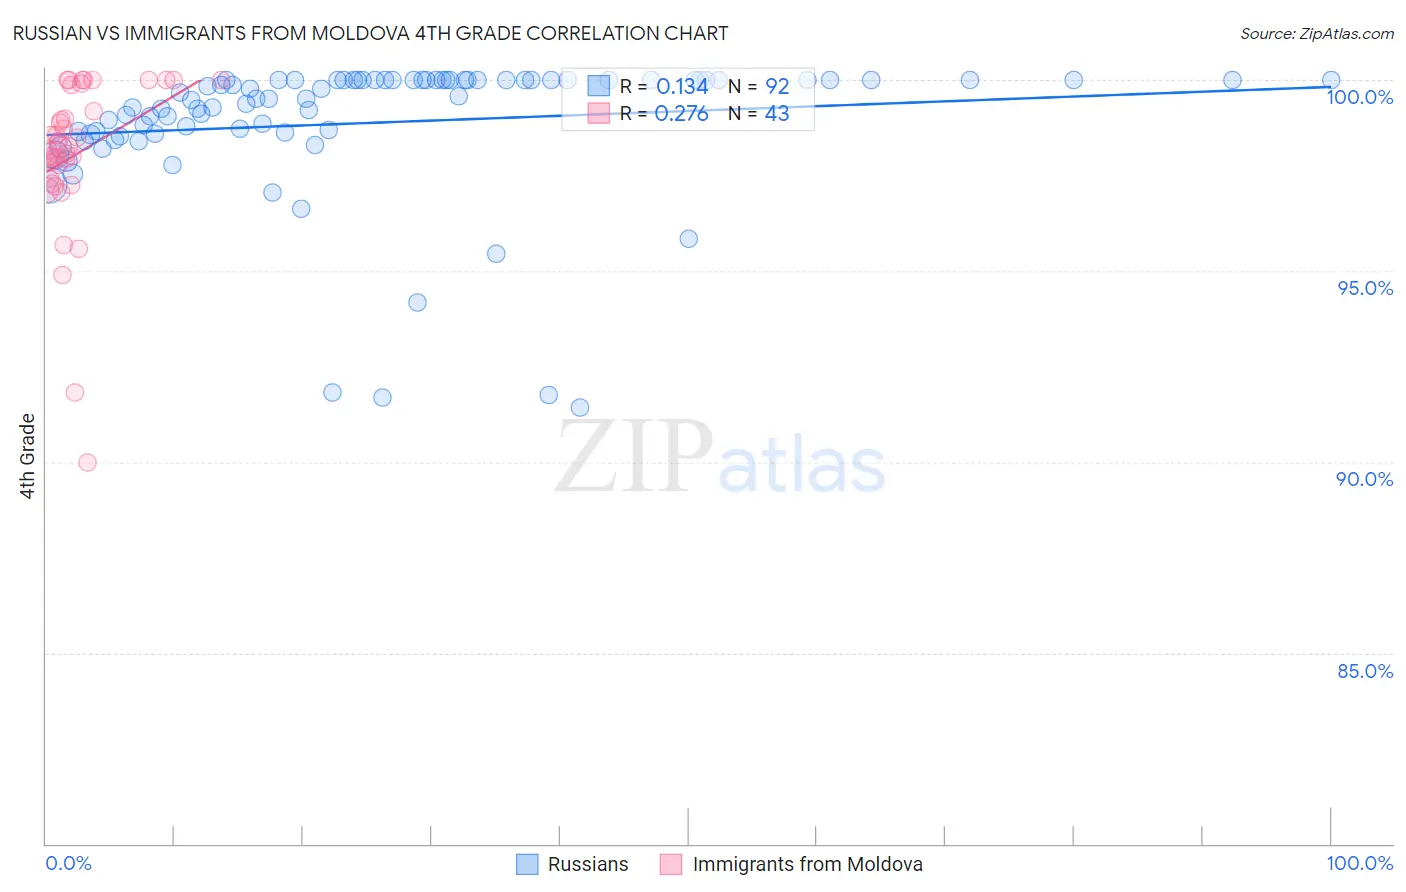
Russian vs Immigrants from Moldova 4th Grade Correlation Chart
The statistical analysis conducted on geographies consisting of 512,259,139 people shows a poor positive correlation between the proportion of Russians and percentage of population with at least 4th grade education in the United States with a correlation coefficient (R) of 0.134 and weighted average of 98.0%. Similarly, the statistical analysis conducted on geographies consisting of 124,398,501 people shows a weak positive correlation between the proportion of Immigrants from Moldova and percentage of population with at least 4th grade education in the United States with a correlation coefficient (R) of 0.276 and weighted average of 97.7%, a difference of 0.40%.
4th Grade Correlation Summary
| Measurement | Russian | Immigrants from Moldova |
| Minimum | 91.4% | 90.0% |
| Maximum | 100.0% | 100.0% |
| Range | 8.6% | 10.0% |
| Mean | 98.9% | 98.0% |
| Median | 99.5% | 98.3% |
| Interquartile 25% (IQ1) | 98.6% | 97.4% |
| Interquartile 75% (IQ3) | 100.0% | 99.9% |
| Interquartile Range (IQR) | 1.4% | 2.4% |
| Standard Deviation (Sample) | 1.9% | 2.0% |
| Standard Deviation (Population) | 1.9% | 2.0% |
Similar Demographics by 4th Grade
Demographics Similar to Russians by 4th Grade
In terms of 4th grade, the demographic groups most similar to Russians are Immigrants from Canada (98.1%, a difference of 0.010%), Immigrants from North America (98.1%, a difference of 0.010%), Serbian (98.1%, a difference of 0.010%), Cajun (98.0%, a difference of 0.010%), and Immigrants from Northern Europe (98.0%, a difference of 0.010%).
| Demographics | Rating | Rank | 4th Grade |
| Greeks | 99.8 /100 | #56 | Exceptional 98.1% |
| Austrians | 99.8 /100 | #57 | Exceptional 98.1% |
| Creek | 99.8 /100 | #58 | Exceptional 98.1% |
| Americans | 99.8 /100 | #59 | Exceptional 98.1% |
| Immigrants | Canada | 99.7 /100 | #60 | Exceptional 98.1% |
| Immigrants | North America | 99.7 /100 | #61 | Exceptional 98.1% |
| Serbians | 99.7 /100 | #62 | Exceptional 98.1% |
| Russians | 99.7 /100 | #63 | Exceptional 98.0% |
| Cajuns | 99.7 /100 | #64 | Exceptional 98.0% |
| Immigrants | Northern Europe | 99.6 /100 | #65 | Exceptional 98.0% |
| Canadians | 99.6 /100 | #66 | Exceptional 98.0% |
| New Zealanders | 99.6 /100 | #67 | Exceptional 98.0% |
| Kiowa | 99.6 /100 | #68 | Exceptional 98.0% |
| Pueblo | 99.6 /100 | #69 | Exceptional 98.0% |
| Immigrants | Austria | 99.6 /100 | #70 | Exceptional 98.0% |
Demographics Similar to Immigrants from Moldova by 4th Grade
In terms of 4th grade, the demographic groups most similar to Immigrants from Moldova are Burmese (97.7%, a difference of 0.0%), Spaniard (97.7%, a difference of 0.0%), Filipino (97.7%, a difference of 0.010%), Immigrants from Greece (97.7%, a difference of 0.010%), and Immigrants from North Macedonia (97.7%, a difference of 0.010%).
| Demographics | Rating | Rank | 4th Grade |
| Blackfeet | 86.0 /100 | #138 | Excellent 97.7% |
| Seminole | 84.7 /100 | #139 | Excellent 97.7% |
| Filipinos | 84.0 /100 | #140 | Excellent 97.7% |
| Immigrants | Greece | 83.8 /100 | #141 | Excellent 97.7% |
| Immigrants | North Macedonia | 83.3 /100 | #142 | Excellent 97.7% |
| Burmese | 82.8 /100 | #143 | Excellent 97.7% |
| Spaniards | 82.7 /100 | #144 | Excellent 97.7% |
| Immigrants | Moldova | 82.4 /100 | #145 | Excellent 97.7% |
| Jordanians | 81.3 /100 | #146 | Excellent 97.7% |
| Ute | 80.6 /100 | #147 | Excellent 97.7% |
| Hopi | 80.6 /100 | #148 | Excellent 97.7% |
| Soviet Union | 77.8 /100 | #149 | Good 97.6% |
| Immigrants | Israel | 77.7 /100 | #150 | Good 97.6% |
| Alsatians | 77.2 /100 | #151 | Good 97.6% |
| Immigrants | South Central Asia | 76.2 /100 | #152 | Good 97.6% |