Immigrants from Oceania vs Immigrants from Latin America Professional Degree
COMPARE
Immigrants from Oceania
Immigrants from Latin America
Professional Degree
Professional Degree Comparison
Immigrants from Oceania
Immigrants from Latin America
4.6%
PROFESSIONAL DEGREE
73.4/ 100
METRIC RATING
150th/ 347
METRIC RANK
3.3%
PROFESSIONAL DEGREE
0.1/ 100
METRIC RATING
310th/ 347
METRIC RANK
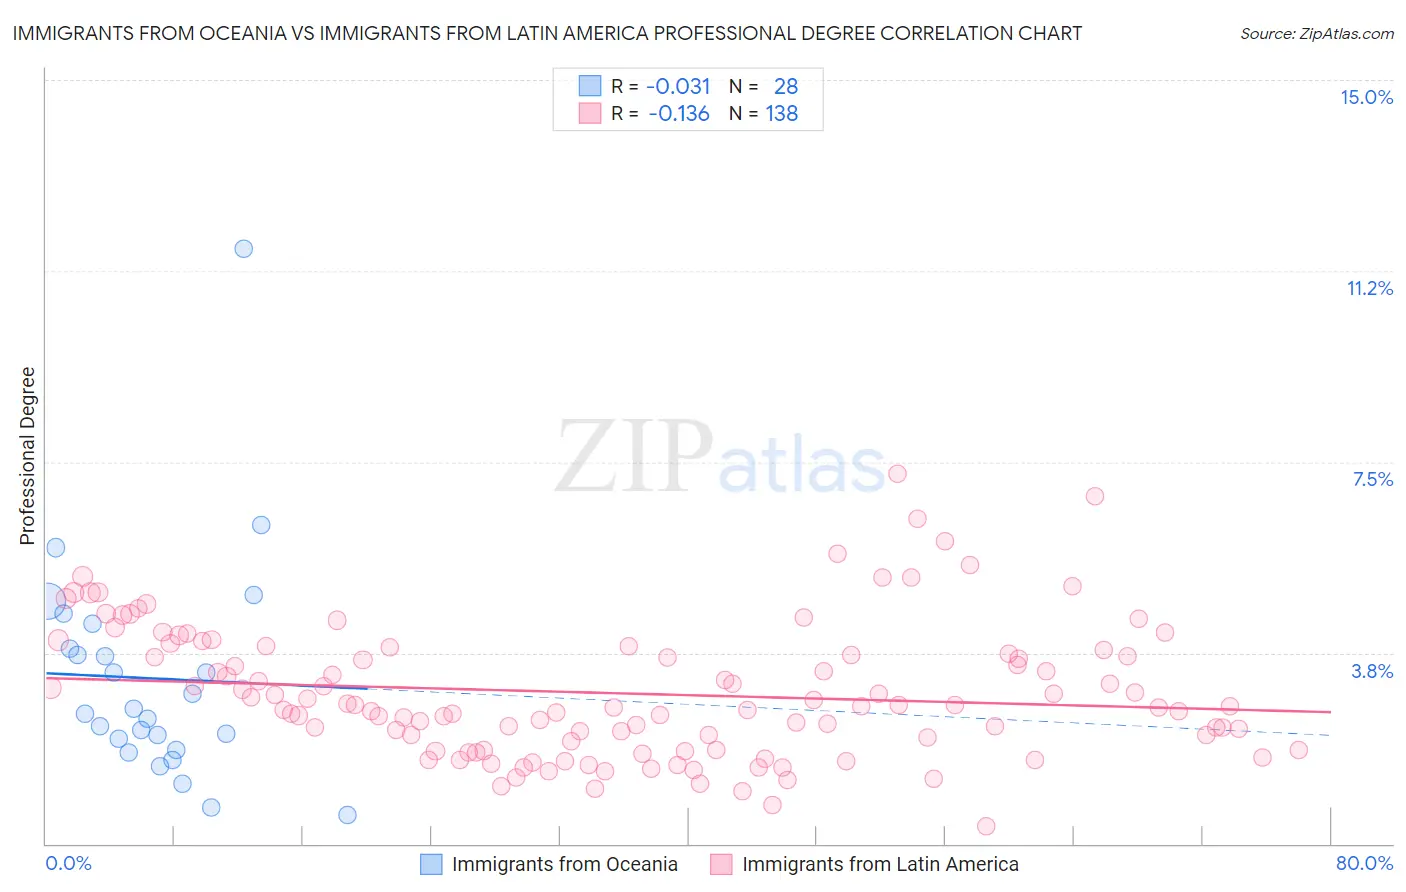
Immigrants from Oceania vs Immigrants from Latin America Professional Degree Correlation Chart
The statistical analysis conducted on geographies consisting of 305,056,134 people shows no correlation between the proportion of Immigrants from Oceania and percentage of population with at least professional degree education in the United States with a correlation coefficient (R) of -0.031 and weighted average of 4.6%. Similarly, the statistical analysis conducted on geographies consisting of 551,972,291 people shows a poor negative correlation between the proportion of Immigrants from Latin America and percentage of population with at least professional degree education in the United States with a correlation coefficient (R) of -0.136 and weighted average of 3.3%, a difference of 38.5%.
Professional Degree Correlation Summary
| Measurement | Immigrants from Oceania | Immigrants from Latin America |
| Minimum | 0.57% | 0.34% |
| Maximum | 11.7% | 7.3% |
| Range | 11.1% | 6.9% |
| Mean | 3.2% | 3.0% |
| Median | 2.6% | 2.7% |
| Interquartile 25% (IQ1) | 2.0% | 1.8% |
| Interquartile 75% (IQ3) | 4.1% | 3.8% |
| Interquartile Range (IQR) | 2.1% | 2.0% |
| Standard Deviation (Sample) | 2.2% | 1.3% |
| Standard Deviation (Population) | 2.2% | 1.3% |
Similar Demographics by Professional Degree
Demographics Similar to Immigrants from Oceania by Professional Degree
In terms of professional degree, the demographic groups most similar to Immigrants from Oceania are Polish (4.6%, a difference of 0.14%), Immigrants from Africa (4.6%, a difference of 0.15%), Immigrants from Uruguay (4.6%, a difference of 0.16%), Scottish (4.6%, a difference of 0.28%), and Senegalese (4.6%, a difference of 0.35%).
| Demographics | Rating | Rank | Professional Degree |
| Hungarians | 80.8 /100 | #143 | Excellent 4.6% |
| Immigrants | South America | 80.5 /100 | #144 | Excellent 4.6% |
| Uruguayans | 80.2 /100 | #145 | Excellent 4.6% |
| Luxembourgers | 78.7 /100 | #146 | Good 4.6% |
| Colombians | 77.7 /100 | #147 | Good 4.6% |
| Slovenes | 76.1 /100 | #148 | Good 4.6% |
| Senegalese | 75.3 /100 | #149 | Good 4.6% |
| Immigrants | Oceania | 73.4 /100 | #150 | Good 4.6% |
| Poles | 72.6 /100 | #151 | Good 4.6% |
| Immigrants | Africa | 72.5 /100 | #152 | Good 4.6% |
| Immigrants | Uruguay | 72.5 /100 | #153 | Good 4.6% |
| Scottish | 71.8 /100 | #154 | Good 4.6% |
| Slavs | 70.8 /100 | #155 | Good 4.5% |
| Swedes | 69.9 /100 | #156 | Good 4.5% |
| Iraqis | 69.8 /100 | #157 | Good 4.5% |
Demographics Similar to Immigrants from Latin America by Professional Degree
In terms of professional degree, the demographic groups most similar to Immigrants from Latin America are Cherokee (3.3%, a difference of 0.15%), Pima (3.3%, a difference of 0.32%), Shoshone (3.3%, a difference of 0.33%), Sioux (3.3%, a difference of 0.75%), and Yuman (3.3%, a difference of 0.76%).
| Demographics | Rating | Rank | Professional Degree |
| Immigrants | Haiti | 0.2 /100 | #303 | Tragic 3.4% |
| Cajuns | 0.2 /100 | #304 | Tragic 3.4% |
| Chickasaw | 0.1 /100 | #305 | Tragic 3.4% |
| Cape Verdeans | 0.1 /100 | #306 | Tragic 3.4% |
| Samoans | 0.1 /100 | #307 | Tragic 3.3% |
| Shoshone | 0.1 /100 | #308 | Tragic 3.3% |
| Pima | 0.1 /100 | #309 | Tragic 3.3% |
| Immigrants | Latin America | 0.1 /100 | #310 | Tragic 3.3% |
| Cherokee | 0.1 /100 | #311 | Tragic 3.3% |
| Sioux | 0.1 /100 | #312 | Tragic 3.3% |
| Yuman | 0.1 /100 | #313 | Tragic 3.3% |
| Mexican American Indians | 0.1 /100 | #314 | Tragic 3.3% |
| Immigrants | Laos | 0.1 /100 | #315 | Tragic 3.2% |
| Puerto Ricans | 0.1 /100 | #316 | Tragic 3.2% |
| Nepalese | 0.1 /100 | #317 | Tragic 3.2% |