Romanian vs Black/African American High School Diploma
COMPARE
Romanian
Black/African American
High School Diploma
High School Diploma Comparison
Romanians
Blacks/African Americans
90.7%
HIGH SCHOOL DIPLOMA
98.9/ 100
METRIC RATING
85th/ 347
METRIC RANK
87.0%
HIGH SCHOOL DIPLOMA
0.2/ 100
METRIC RATING
267th/ 347
METRIC RANK
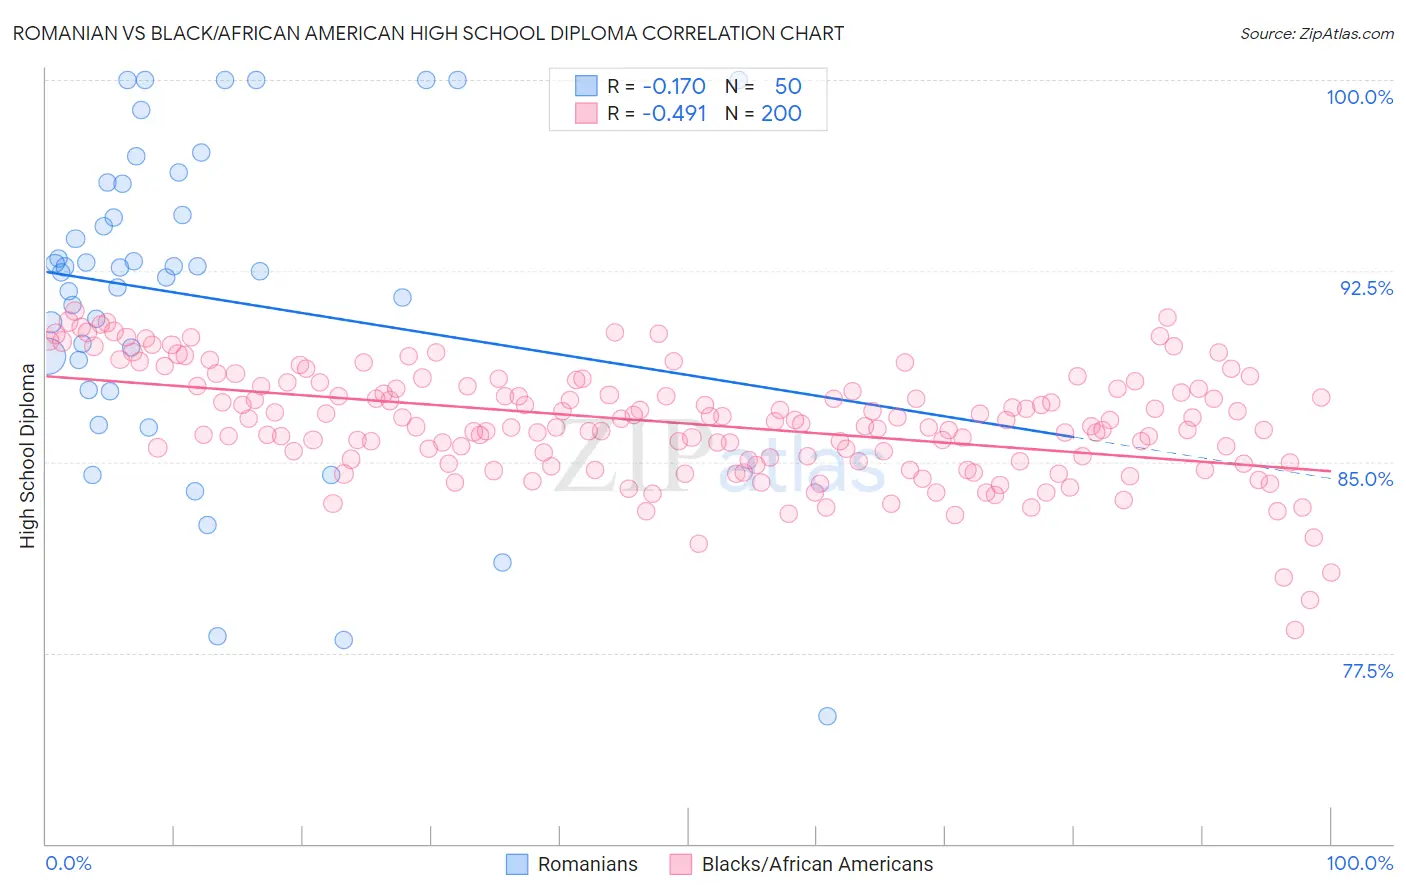
Romanian vs Black/African American High School Diploma Correlation Chart
The statistical analysis conducted on geographies consisting of 377,905,122 people shows a poor negative correlation between the proportion of Romanians and percentage of population with at least high school diploma education in the United States with a correlation coefficient (R) of -0.170 and weighted average of 90.7%. Similarly, the statistical analysis conducted on geographies consisting of 566,048,038 people shows a moderate negative correlation between the proportion of Blacks/African Americans and percentage of population with at least high school diploma education in the United States with a correlation coefficient (R) of -0.491 and weighted average of 87.0%, a difference of 4.2%.
High School Diploma Correlation Summary
| Measurement | Romanian | Black/African American |
| Minimum | 75.0% | 78.4% |
| Maximum | 100.0% | 90.9% |
| Range | 25.0% | 12.5% |
| Mean | 91.6% | 86.5% |
| Median | 92.6% | 86.4% |
| Interquartile 25% (IQ1) | 89.0% | 85.0% |
| Interquartile 75% (IQ3) | 95.9% | 88.0% |
| Interquartile Range (IQR) | 7.0% | 3.0% |
| Standard Deviation (Sample) | 6.1% | 2.2% |
| Standard Deviation (Population) | 6.0% | 2.2% |
Similar Demographics by High School Diploma
Demographics Similar to Romanians by High School Diploma
In terms of high school diploma, the demographic groups most similar to Romanians are Immigrants from Bulgaria (90.6%, a difference of 0.010%), Immigrants from Turkey (90.6%, a difference of 0.010%), Immigrants from France (90.6%, a difference of 0.030%), Canadian (90.6%, a difference of 0.050%), and Celtic (90.6%, a difference of 0.060%).
| Demographics | Rating | Rank | High School Diploma |
| Burmese | 99.3 /100 | #78 | Exceptional 90.8% |
| Immigrants | Denmark | 99.3 /100 | #79 | Exceptional 90.8% |
| Immigrants | England | 99.3 /100 | #80 | Exceptional 90.8% |
| Immigrants | Switzerland | 99.3 /100 | #81 | Exceptional 90.8% |
| Scotch-Irish | 99.2 /100 | #82 | Exceptional 90.8% |
| Immigrants | Moldova | 99.2 /100 | #83 | Exceptional 90.7% |
| Immigrants | Saudi Arabia | 99.1 /100 | #84 | Exceptional 90.7% |
| Romanians | 98.9 /100 | #85 | Exceptional 90.7% |
| Immigrants | Bulgaria | 98.9 /100 | #86 | Exceptional 90.6% |
| Immigrants | Turkey | 98.9 /100 | #87 | Exceptional 90.6% |
| Immigrants | France | 98.8 /100 | #88 | Exceptional 90.6% |
| Canadians | 98.7 /100 | #89 | Exceptional 90.6% |
| Celtics | 98.7 /100 | #90 | Exceptional 90.6% |
| South Africans | 98.6 /100 | #91 | Exceptional 90.6% |
| Swiss | 98.6 /100 | #92 | Exceptional 90.6% |
Demographics Similar to Blacks/African Americans by High School Diploma
In terms of high school diploma, the demographic groups most similar to Blacks/African Americans are Immigrants from Congo (87.0%, a difference of 0.010%), Pennsylvania German (87.0%, a difference of 0.030%), Sri Lankan (87.0%, a difference of 0.040%), U.S. Virgin Islander (87.1%, a difference of 0.060%), and Malaysian (87.0%, a difference of 0.060%).
| Demographics | Rating | Rank | High School Diploma |
| Cajuns | 0.4 /100 | #260 | Tragic 87.3% |
| Seminole | 0.4 /100 | #261 | Tragic 87.3% |
| Immigrants | Peru | 0.4 /100 | #262 | Tragic 87.3% |
| Immigrants | South Eastern Asia | 0.3 /100 | #263 | Tragic 87.2% |
| Jamaicans | 0.3 /100 | #264 | Tragic 87.2% |
| U.S. Virgin Islanders | 0.2 /100 | #265 | Tragic 87.1% |
| Immigrants | Congo | 0.2 /100 | #266 | Tragic 87.0% |
| Blacks/African Americans | 0.2 /100 | #267 | Tragic 87.0% |
| Pennsylvania Germans | 0.2 /100 | #268 | Tragic 87.0% |
| Sri Lankans | 0.2 /100 | #269 | Tragic 87.0% |
| Malaysians | 0.2 /100 | #270 | Tragic 87.0% |
| West Indians | 0.1 /100 | #271 | Tragic 86.9% |
| Trinidadians and Tobagonians | 0.1 /100 | #272 | Tragic 86.9% |
| Immigrants | Jamaica | 0.1 /100 | #273 | Tragic 86.9% |
| Bangladeshis | 0.1 /100 | #274 | Tragic 86.9% |