Immigrants from Australia vs Black/African American High School Diploma
COMPARE
Immigrants from Australia
Black/African American
High School Diploma
High School Diploma Comparison
Immigrants from Australia
Blacks/African Americans
91.3%
HIGH SCHOOL DIPLOMA
99.8/ 100
METRIC RATING
41st/ 347
METRIC RANK
87.0%
HIGH SCHOOL DIPLOMA
0.2/ 100
METRIC RATING
267th/ 347
METRIC RANK
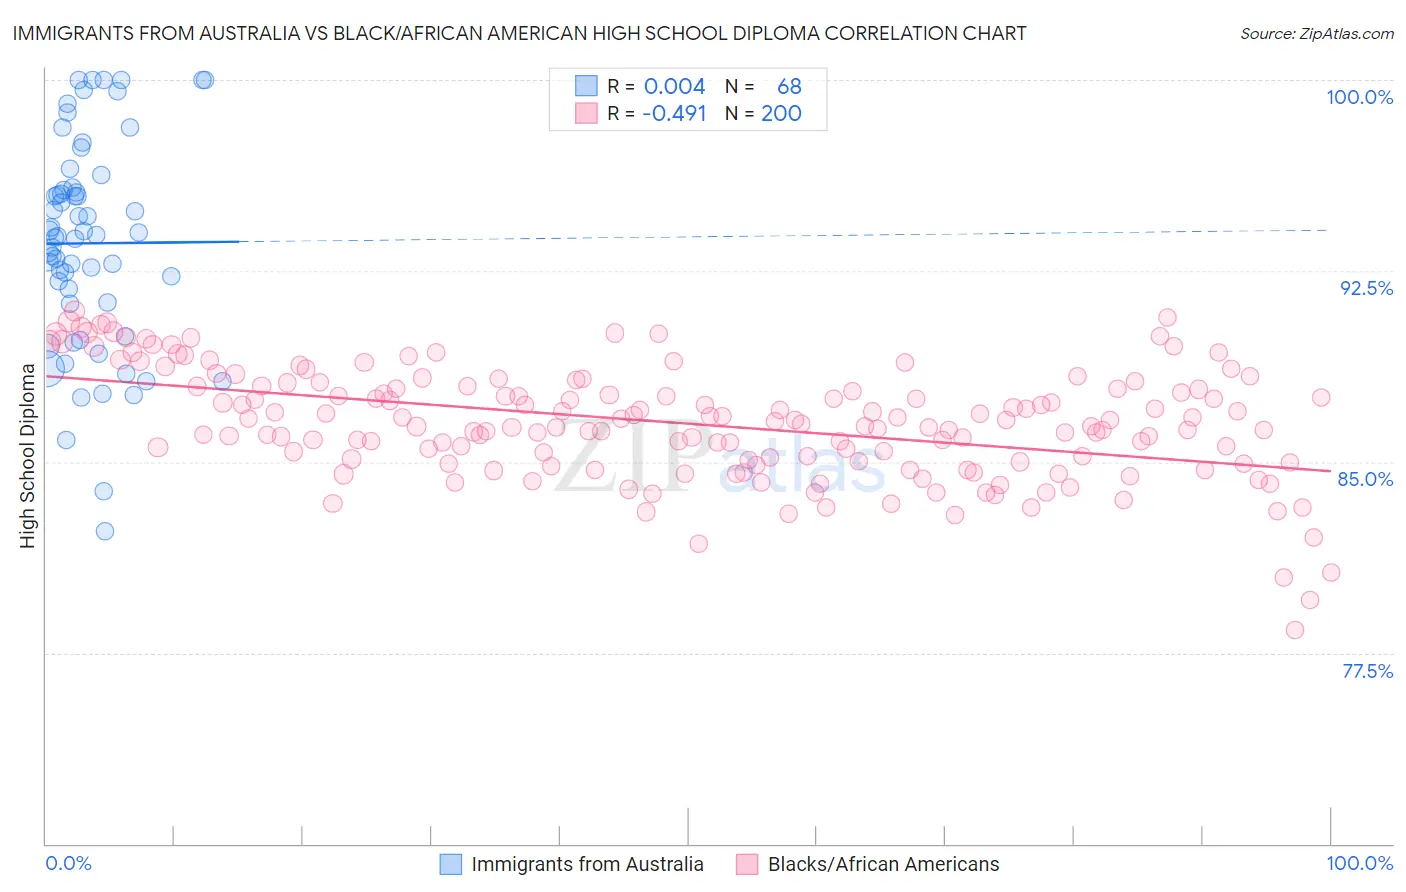
Immigrants from Australia vs Black/African American High School Diploma Correlation Chart
The statistical analysis conducted on geographies consisting of 227,202,828 people shows no correlation between the proportion of Immigrants from Australia and percentage of population with at least high school diploma education in the United States with a correlation coefficient (R) of 0.004 and weighted average of 91.3%. Similarly, the statistical analysis conducted on geographies consisting of 566,048,038 people shows a moderate negative correlation between the proportion of Blacks/African Americans and percentage of population with at least high school diploma education in the United States with a correlation coefficient (R) of -0.491 and weighted average of 87.0%, a difference of 4.9%.
High School Diploma Correlation Summary
| Measurement | Immigrants from Australia | Black/African American |
| Minimum | 82.3% | 78.4% |
| Maximum | 100.0% | 90.9% |
| Range | 17.7% | 12.5% |
| Mean | 93.6% | 86.5% |
| Median | 93.9% | 86.4% |
| Interquartile 25% (IQ1) | 91.2% | 85.0% |
| Interquartile 75% (IQ3) | 95.7% | 88.0% |
| Interquartile Range (IQR) | 4.5% | 3.0% |
| Standard Deviation (Sample) | 4.1% | 2.2% |
| Standard Deviation (Population) | 4.1% | 2.2% |
Similar Demographics by High School Diploma
Demographics Similar to Immigrants from Australia by High School Diploma
In terms of high school diploma, the demographic groups most similar to Immigrants from Australia are Northern European (91.3%, a difference of 0.010%), British (91.3%, a difference of 0.010%), Immigrants from Lithuania (91.3%, a difference of 0.020%), Dutch (91.3%, a difference of 0.030%), and Immigrants from Austria (91.3%, a difference of 0.030%).
| Demographics | Rating | Rank | High School Diploma |
| Scottish | 99.9 /100 | #34 | Exceptional 91.4% |
| Irish | 99.9 /100 | #35 | Exceptional 91.4% |
| Tsimshian | 99.9 /100 | #36 | Exceptional 91.3% |
| Immigrants | Ireland | 99.9 /100 | #37 | Exceptional 91.3% |
| Immigrants | Scotland | 99.8 /100 | #38 | Exceptional 91.3% |
| Dutch | 99.8 /100 | #39 | Exceptional 91.3% |
| Immigrants | Lithuania | 99.8 /100 | #40 | Exceptional 91.3% |
| Immigrants | Australia | 99.8 /100 | #41 | Exceptional 91.3% |
| Northern Europeans | 99.8 /100 | #42 | Exceptional 91.3% |
| British | 99.8 /100 | #43 | Exceptional 91.3% |
| Immigrants | Austria | 99.8 /100 | #44 | Exceptional 91.3% |
| Turks | 99.8 /100 | #45 | Exceptional 91.2% |
| Greeks | 99.8 /100 | #46 | Exceptional 91.2% |
| Australians | 99.8 /100 | #47 | Exceptional 91.2% |
| Belgians | 99.8 /100 | #48 | Exceptional 91.2% |
Demographics Similar to Blacks/African Americans by High School Diploma
In terms of high school diploma, the demographic groups most similar to Blacks/African Americans are Immigrants from Congo (87.0%, a difference of 0.010%), Pennsylvania German (87.0%, a difference of 0.030%), Sri Lankan (87.0%, a difference of 0.040%), U.S. Virgin Islander (87.1%, a difference of 0.060%), and Malaysian (87.0%, a difference of 0.060%).
| Demographics | Rating | Rank | High School Diploma |
| Cajuns | 0.4 /100 | #260 | Tragic 87.3% |
| Seminole | 0.4 /100 | #261 | Tragic 87.3% |
| Immigrants | Peru | 0.4 /100 | #262 | Tragic 87.3% |
| Immigrants | South Eastern Asia | 0.3 /100 | #263 | Tragic 87.2% |
| Jamaicans | 0.3 /100 | #264 | Tragic 87.2% |
| U.S. Virgin Islanders | 0.2 /100 | #265 | Tragic 87.1% |
| Immigrants | Congo | 0.2 /100 | #266 | Tragic 87.0% |
| Blacks/African Americans | 0.2 /100 | #267 | Tragic 87.0% |
| Pennsylvania Germans | 0.2 /100 | #268 | Tragic 87.0% |
| Sri Lankans | 0.2 /100 | #269 | Tragic 87.0% |
| Malaysians | 0.2 /100 | #270 | Tragic 87.0% |
| West Indians | 0.1 /100 | #271 | Tragic 86.9% |
| Trinidadians and Tobagonians | 0.1 /100 | #272 | Tragic 86.9% |
| Immigrants | Jamaica | 0.1 /100 | #273 | Tragic 86.9% |
| Bangladeshis | 0.1 /100 | #274 | Tragic 86.9% |