Apache vs Mexican American Indian 5th Grade
COMPARE
Apache
Mexican American Indian
5th Grade
5th Grade Comparison
Apache
Mexican American Indians
97.4%
5TH GRADE
57.2/ 100
METRIC RATING
166th/ 347
METRIC RANK
95.5%
5TH GRADE
0.0/ 100
METRIC RATING
329th/ 347
METRIC RANK
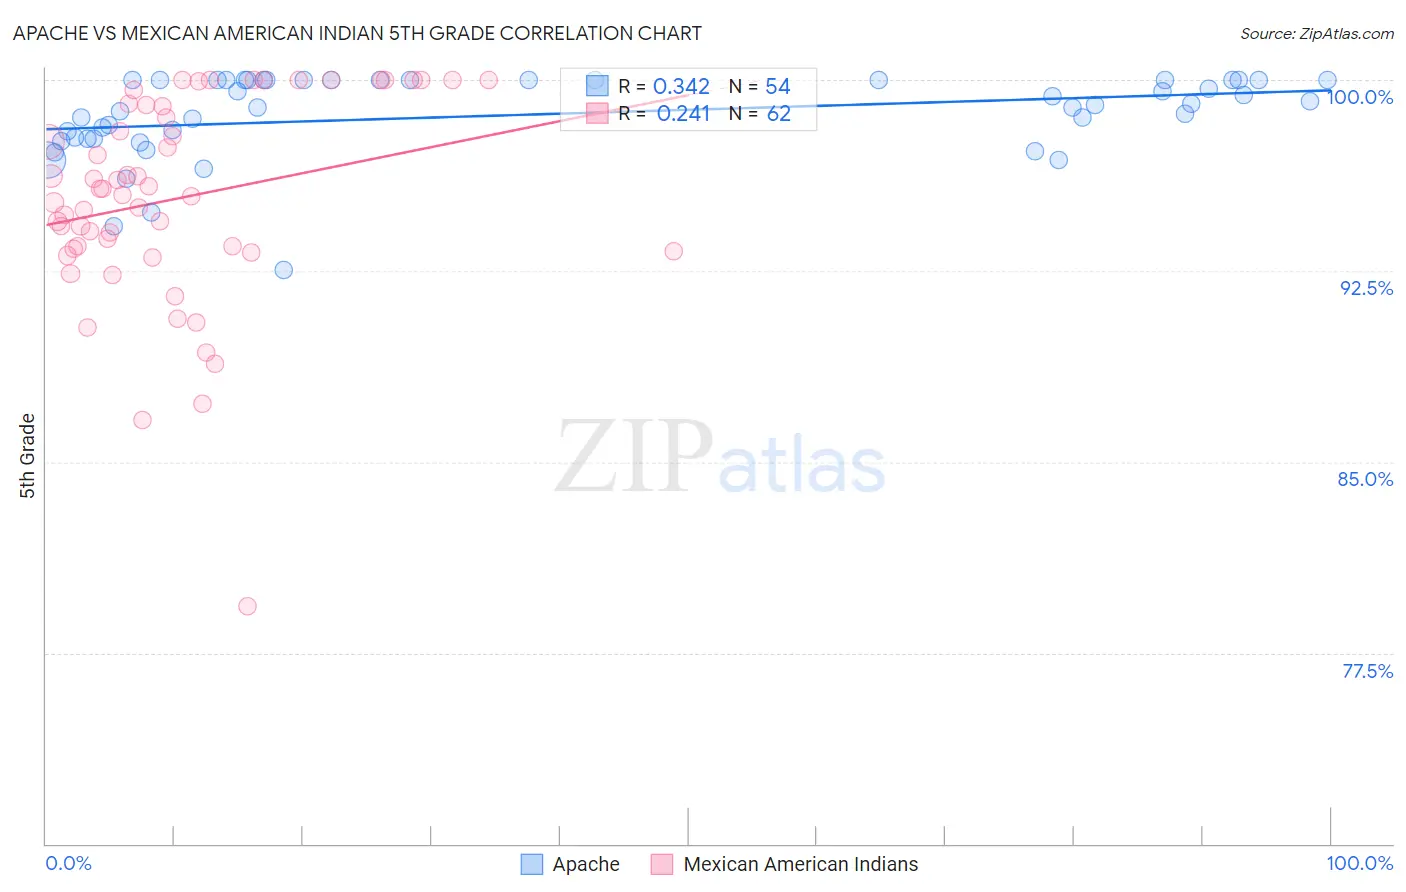
Apache vs Mexican American Indian 5th Grade Correlation Chart
The statistical analysis conducted on geographies consisting of 231,142,814 people shows a mild positive correlation between the proportion of Apache and percentage of population with at least 5th grade education in the United States with a correlation coefficient (R) of 0.342 and weighted average of 97.4%. Similarly, the statistical analysis conducted on geographies consisting of 317,621,104 people shows a weak positive correlation between the proportion of Mexican American Indians and percentage of population with at least 5th grade education in the United States with a correlation coefficient (R) of 0.241 and weighted average of 95.5%, a difference of 1.9%.
5th Grade Correlation Summary
| Measurement | Apache | Mexican American Indian |
| Minimum | 92.5% | 79.3% |
| Maximum | 100.0% | 100.0% |
| Range | 7.5% | 20.7% |
| Mean | 98.6% | 95.4% |
| Median | 99.0% | 95.6% |
| Interquartile 25% (IQ1) | 97.7% | 93.4% |
| Interquartile 75% (IQ3) | 100.0% | 99.0% |
| Interquartile Range (IQR) | 2.3% | 5.6% |
| Standard Deviation (Sample) | 1.6% | 4.1% |
| Standard Deviation (Population) | 1.6% | 4.0% |
Similar Demographics by 5th Grade
Demographics Similar to Apache by 5th Grade
In terms of 5th grade, the demographic groups most similar to Apache are Immigrants from Poland (97.4%, a difference of 0.0%), Kenyan (97.4%, a difference of 0.010%), Immigrants from Iran (97.4%, a difference of 0.010%), Ugandan (97.4%, a difference of 0.010%), and Bermudan (97.4%, a difference of 0.010%).
| Demographics | Rating | Rank | 5th Grade |
| Immigrants | Italy | 65.2 /100 | #159 | Good 97.4% |
| Marshallese | 61.2 /100 | #160 | Good 97.4% |
| Kenyans | 59.7 /100 | #161 | Average 97.4% |
| Immigrants | Iran | 59.5 /100 | #162 | Average 97.4% |
| Ugandans | 58.9 /100 | #163 | Average 97.4% |
| Bermudans | 58.8 /100 | #164 | Average 97.4% |
| Immigrants | Poland | 57.9 /100 | #165 | Average 97.4% |
| Apache | 57.2 /100 | #166 | Average 97.4% |
| Immigrants | Belarus | 54.6 /100 | #167 | Average 97.3% |
| Chileans | 54.5 /100 | #168 | Average 97.3% |
| Immigrants | Korea | 54.1 /100 | #169 | Average 97.3% |
| Venezuelans | 54.0 /100 | #170 | Average 97.3% |
| Immigrants | Sri Lanka | 53.8 /100 | #171 | Average 97.3% |
| Arabs | 53.4 /100 | #172 | Average 97.3% |
| Egyptians | 52.4 /100 | #173 | Average 97.3% |
Demographics Similar to Mexican American Indians by 5th Grade
In terms of 5th grade, the demographic groups most similar to Mexican American Indians are Cape Verdean (95.5%, a difference of 0.010%), Immigrants from Cambodia (95.5%, a difference of 0.040%), Dominican (95.5%, a difference of 0.040%), Honduran (95.6%, a difference of 0.070%), and Hispanic or Latino (95.6%, a difference of 0.070%).
| Demographics | Rating | Rank | 5th Grade |
| Immigrants | Nicaragua | 0.0 /100 | #322 | Tragic 95.6% |
| Immigrants | Fiji | 0.0 /100 | #323 | Tragic 95.6% |
| Hondurans | 0.0 /100 | #324 | Tragic 95.6% |
| Hispanics or Latinos | 0.0 /100 | #325 | Tragic 95.6% |
| Immigrants | Cambodia | 0.0 /100 | #326 | Tragic 95.5% |
| Dominicans | 0.0 /100 | #327 | Tragic 95.5% |
| Cape Verdeans | 0.0 /100 | #328 | Tragic 95.5% |
| Mexican American Indians | 0.0 /100 | #329 | Tragic 95.5% |
| Immigrants | Armenia | 0.0 /100 | #330 | Tragic 95.4% |
| Immigrants | Honduras | 0.0 /100 | #331 | Tragic 95.4% |
| Immigrants | Dominican Republic | 0.0 /100 | #332 | Tragic 95.3% |
| Immigrants | Latin America | 0.0 /100 | #333 | Tragic 95.3% |
| Nepalese | 0.0 /100 | #334 | Tragic 95.2% |
| Mexicans | 0.0 /100 | #335 | Tragic 95.2% |
| Immigrants | Azores | 0.0 /100 | #336 | Tragic 95.1% |