Puget Sound Salish vs Cypriot 3rd Grade
COMPARE
Puget Sound Salish
Cypriot
3rd Grade
3rd Grade Comparison
Puget Sound Salish
Cypriots
98.1%
3RD GRADE
97.9/ 100
METRIC RATING
101st/ 347
METRIC RANK
98.1%
3RD GRADE
98.4/ 100
METRIC RATING
95th/ 347
METRIC RANK
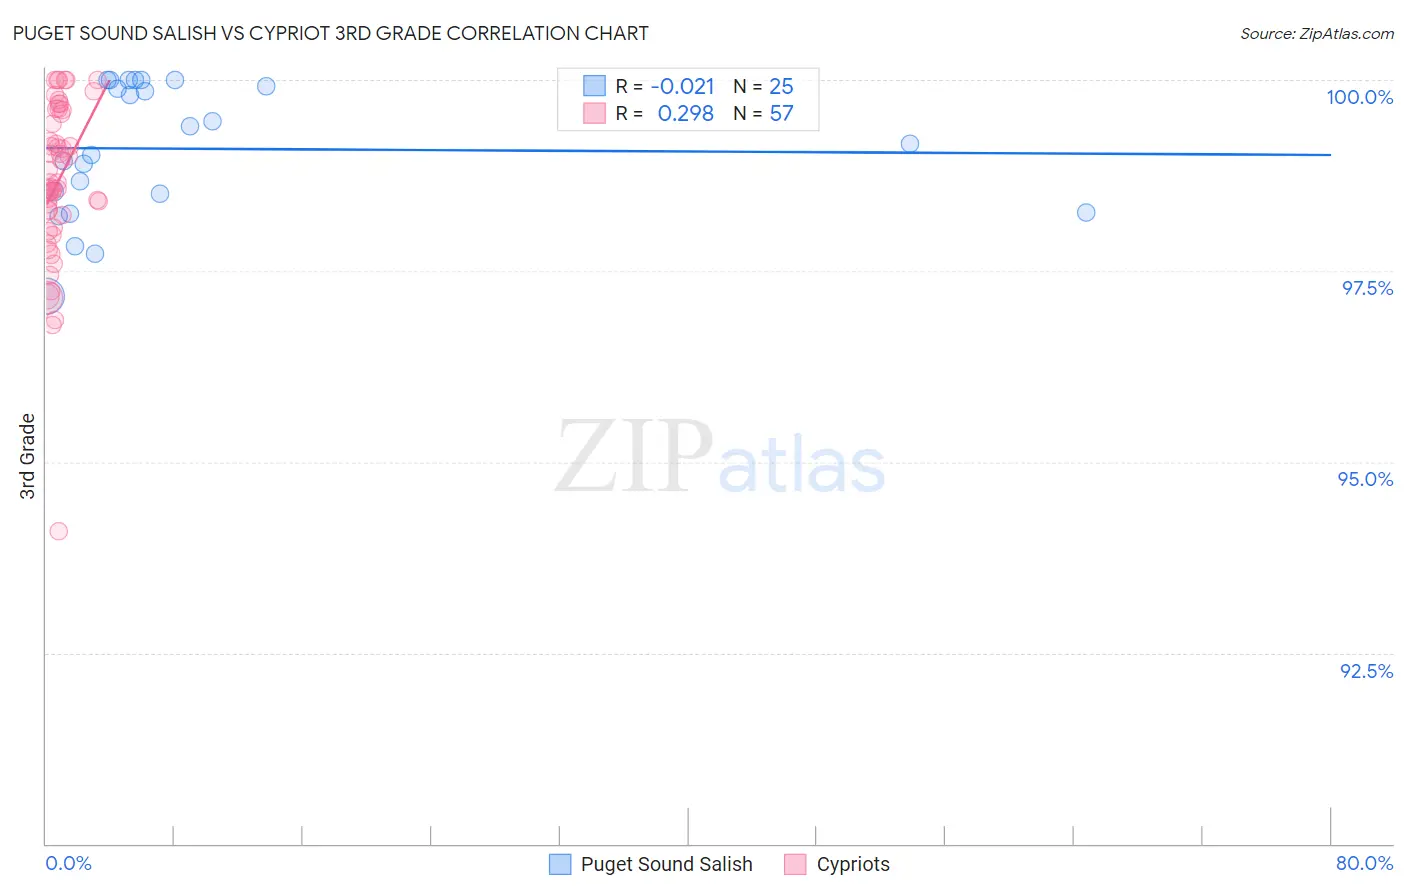
Puget Sound Salish vs Cypriot 3rd Grade Correlation Chart
The statistical analysis conducted on geographies consisting of 46,155,746 people shows no correlation between the proportion of Puget Sound Salish and percentage of population with at least 3rd grade education in the United States with a correlation coefficient (R) of -0.021 and weighted average of 98.1%. Similarly, the statistical analysis conducted on geographies consisting of 61,870,289 people shows a weak positive correlation between the proportion of Cypriots and percentage of population with at least 3rd grade education in the United States with a correlation coefficient (R) of 0.298 and weighted average of 98.1%, a difference of 0.020%.
3rd Grade Correlation Summary
| Measurement | Puget Sound Salish | Cypriot |
| Minimum | 97.2% | 94.1% |
| Maximum | 100.0% | 100.0% |
| Range | 2.8% | 5.9% |
| Mean | 99.1% | 98.7% |
| Median | 99.2% | 98.7% |
| Interquartile 25% (IQ1) | 98.4% | 98.1% |
| Interquartile 75% (IQ3) | 100.0% | 99.6% |
| Interquartile Range (IQR) | 1.6% | 1.4% |
| Standard Deviation (Sample) | 0.86% | 1.1% |
| Standard Deviation (Population) | 0.84% | 1.1% |
Demographics Similar to Puget Sound Salish and Cypriots by 3rd Grade
In terms of 3rd grade, the demographic groups most similar to Puget Sound Salish are Romanian (98.1%, a difference of 0.0%), Cree (98.1%, a difference of 0.0%), Nonimmigrants (98.1%, a difference of 0.0%), South African (98.1%, a difference of 0.010%), and Choctaw (98.1%, a difference of 0.010%). Similarly, the demographic groups most similar to Cypriots are Immigrants from Germany (98.1%, a difference of 0.0%), Immigrants from Ireland (98.1%, a difference of 0.010%), South African (98.1%, a difference of 0.010%), Delaware (98.1%, a difference of 0.020%), and Zimbabwean (98.1%, a difference of 0.020%).
| Demographics | Rating | Rank | 3rd Grade |
| Immigrants | India | 98.8 /100 | #88 | Exceptional 98.1% |
| Delaware | 98.8 /100 | #89 | Exceptional 98.1% |
| Zimbabweans | 98.8 /100 | #90 | Exceptional 98.1% |
| Hopi | 98.7 /100 | #91 | Exceptional 98.1% |
| Immigrants | South Africa | 98.7 /100 | #92 | Exceptional 98.1% |
| Immigrants | Western Europe | 98.7 /100 | #93 | Exceptional 98.1% |
| Immigrants | Germany | 98.4 /100 | #94 | Exceptional 98.1% |
| Cypriots | 98.4 /100 | #95 | Exceptional 98.1% |
| Immigrants | Ireland | 98.2 /100 | #96 | Exceptional 98.1% |
| South Africans | 98.2 /100 | #97 | Exceptional 98.1% |
| Choctaw | 98.0 /100 | #98 | Exceptional 98.1% |
| Romanians | 98.0 /100 | #99 | Exceptional 98.1% |
| Cree | 97.9 /100 | #100 | Exceptional 98.1% |
| Puget Sound Salish | 97.9 /100 | #101 | Exceptional 98.1% |
| Immigrants | Nonimmigrants | 97.8 /100 | #102 | Exceptional 98.1% |
| Yugoslavians | 97.7 /100 | #103 | Exceptional 98.1% |
| Turks | 97.6 /100 | #104 | Exceptional 98.1% |
| German Russians | 97.2 /100 | #105 | Exceptional 98.1% |
| Bhutanese | 97.2 /100 | #106 | Exceptional 98.1% |
| Immigrants | Czechoslovakia | 97.0 /100 | #107 | Exceptional 98.0% |
| Immigrants | Singapore | 96.7 /100 | #108 | Exceptional 98.0% |