Puget Sound Salish vs Spanish 3rd Grade
COMPARE
Puget Sound Salish
Spanish
3rd Grade
3rd Grade Comparison
Puget Sound Salish
Spanish
98.1%
3RD GRADE
97.9/ 100
METRIC RATING
101st/ 347
METRIC RANK
98.0%
3RD GRADE
94.8/ 100
METRIC RATING
119th/ 347
METRIC RANK
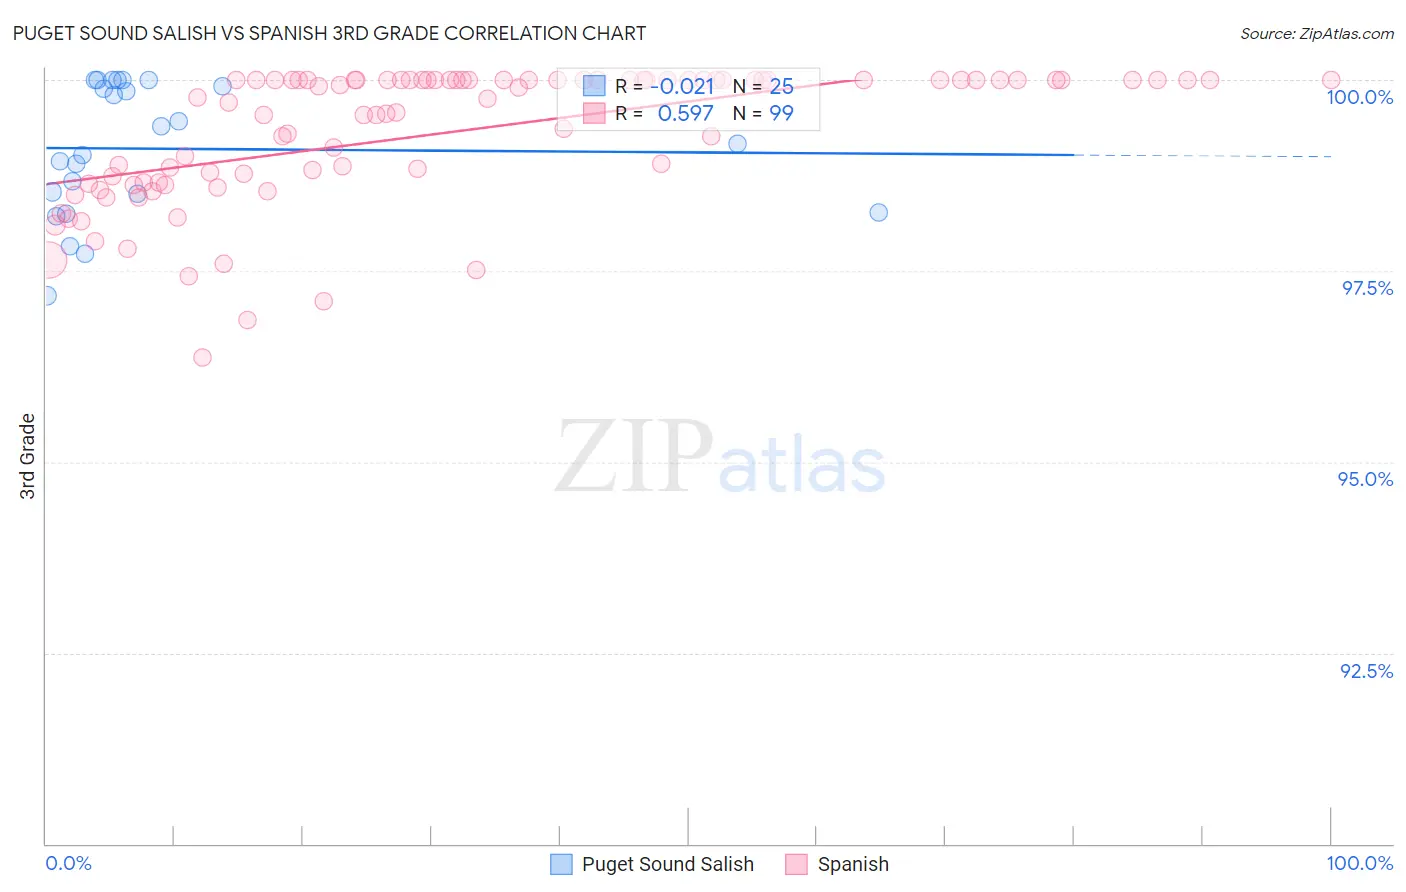
Puget Sound Salish vs Spanish 3rd Grade Correlation Chart
The statistical analysis conducted on geographies consisting of 46,155,746 people shows no correlation between the proportion of Puget Sound Salish and percentage of population with at least 3rd grade education in the United States with a correlation coefficient (R) of -0.021 and weighted average of 98.1%. Similarly, the statistical analysis conducted on geographies consisting of 422,189,210 people shows a substantial positive correlation between the proportion of Spanish and percentage of population with at least 3rd grade education in the United States with a correlation coefficient (R) of 0.597 and weighted average of 98.0%, a difference of 0.080%.
3rd Grade Correlation Summary
| Measurement | Puget Sound Salish | Spanish |
| Minimum | 97.2% | 96.4% |
| Maximum | 100.0% | 100.0% |
| Range | 2.8% | 3.6% |
| Mean | 99.1% | 99.3% |
| Median | 99.2% | 99.9% |
| Interquartile 25% (IQ1) | 98.4% | 98.7% |
| Interquartile 75% (IQ3) | 100.0% | 100.0% |
| Interquartile Range (IQR) | 1.6% | 1.3% |
| Standard Deviation (Sample) | 0.86% | 0.88% |
| Standard Deviation (Population) | 0.84% | 0.88% |
Demographics Similar to Puget Sound Salish and Spanish by 3rd Grade
In terms of 3rd grade, the demographic groups most similar to Puget Sound Salish are Cree (98.1%, a difference of 0.0%), Nonimmigrants (98.1%, a difference of 0.0%), Yugoslavian (98.1%, a difference of 0.010%), Turkish (98.1%, a difference of 0.010%), and German Russian (98.1%, a difference of 0.020%). Similarly, the demographic groups most similar to Spanish are Iranian (98.0%, a difference of 0.0%), Thai (98.0%, a difference of 0.010%), Menominee (98.0%, a difference of 0.010%), Okinawan (98.0%, a difference of 0.010%), and Immigrants from Norway (98.0%, a difference of 0.010%).
| Demographics | Rating | Rank | 3rd Grade |
| Cree | 97.9 /100 | #100 | Exceptional 98.1% |
| Puget Sound Salish | 97.9 /100 | #101 | Exceptional 98.1% |
| Immigrants | Nonimmigrants | 97.8 /100 | #102 | Exceptional 98.1% |
| Yugoslavians | 97.7 /100 | #103 | Exceptional 98.1% |
| Turks | 97.6 /100 | #104 | Exceptional 98.1% |
| German Russians | 97.2 /100 | #105 | Exceptional 98.1% |
| Bhutanese | 97.2 /100 | #106 | Exceptional 98.1% |
| Immigrants | Czechoslovakia | 97.0 /100 | #107 | Exceptional 98.0% |
| Immigrants | Singapore | 96.7 /100 | #108 | Exceptional 98.0% |
| Pima | 96.7 /100 | #109 | Exceptional 98.0% |
| Immigrants | Switzerland | 96.6 /100 | #110 | Exceptional 98.0% |
| Basques | 96.5 /100 | #111 | Exceptional 98.0% |
| Immigrants | Latvia | 96.0 /100 | #112 | Exceptional 98.0% |
| Thais | 95.5 /100 | #113 | Exceptional 98.0% |
| Menominee | 95.4 /100 | #114 | Exceptional 98.0% |
| Okinawans | 95.2 /100 | #115 | Exceptional 98.0% |
| Immigrants | Norway | 95.2 /100 | #116 | Exceptional 98.0% |
| Immigrants | France | 95.1 /100 | #117 | Exceptional 98.0% |
| Iranians | 94.9 /100 | #118 | Exceptional 98.0% |
| Spanish | 94.8 /100 | #119 | Exceptional 98.0% |
| Immigrants | Croatia | 94.4 /100 | #120 | Exceptional 98.0% |