Puerto Rican vs Eastern European 12th Grade, No Diploma
COMPARE
Puerto Rican
Eastern European
12th Grade, No Diploma
12th Grade, No Diploma Comparison
Puerto Ricans
Eastern Europeans
86.5%
12TH GRADE, NO DIPLOMA
0.0/ 100
METRIC RATING
321st/ 347
METRIC RANK
93.5%
12TH GRADE, NO DIPLOMA
100.0/ 100
METRIC RATING
12th/ 347
METRIC RANK
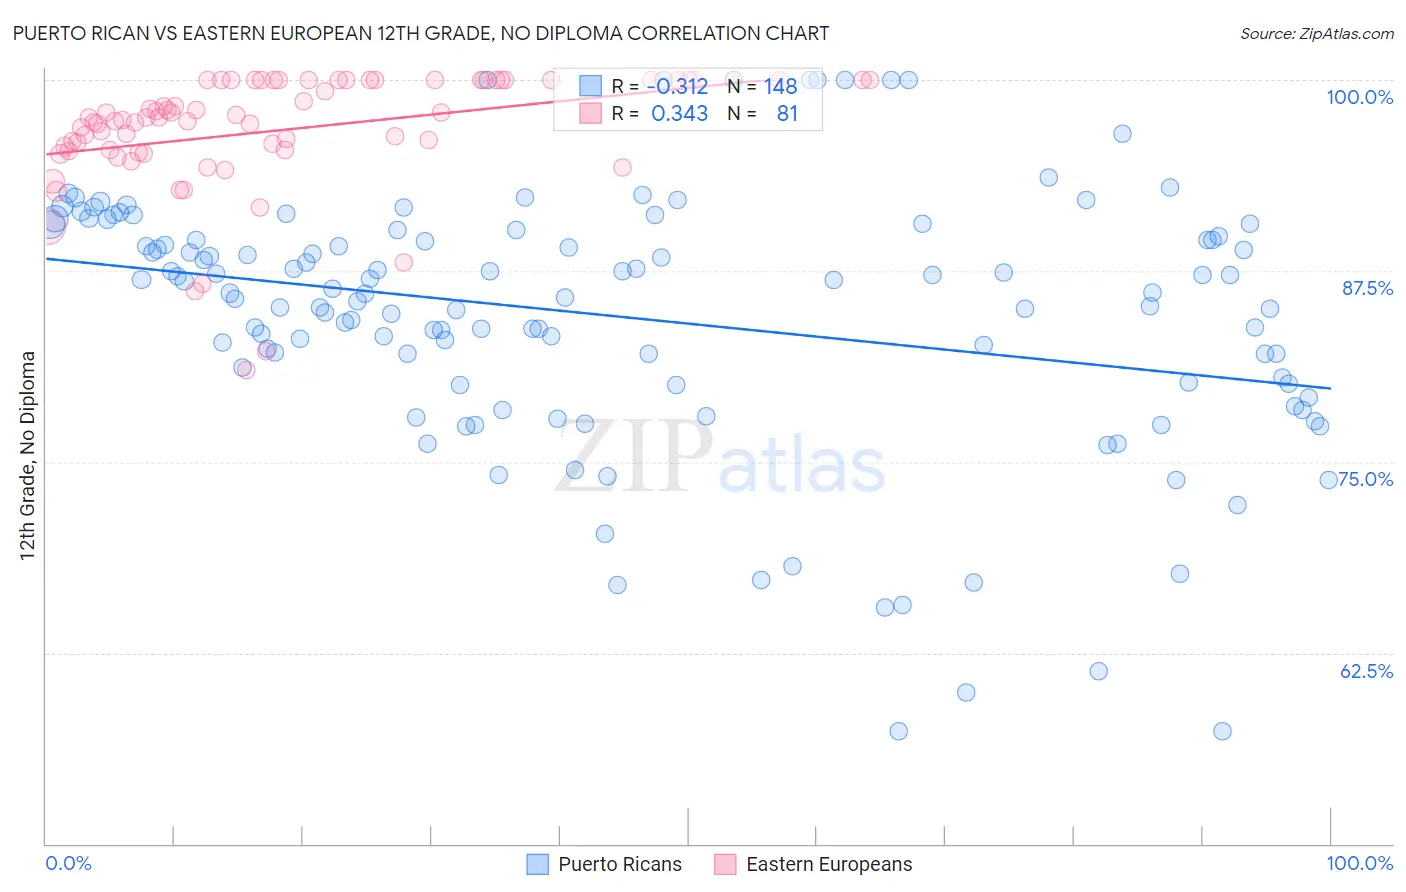
Puerto Rican vs Eastern European 12th Grade, No Diploma Correlation Chart
The statistical analysis conducted on geographies consisting of 528,321,878 people shows a mild negative correlation between the proportion of Puerto Ricans and percentage of population with at least 12th grade (no diploma) education in the United States with a correlation coefficient (R) of -0.312 and weighted average of 86.5%. Similarly, the statistical analysis conducted on geographies consisting of 461,247,615 people shows a mild positive correlation between the proportion of Eastern Europeans and percentage of population with at least 12th grade (no diploma) education in the United States with a correlation coefficient (R) of 0.343 and weighted average of 93.5%, a difference of 8.0%.
12th Grade, No Diploma Correlation Summary
| Measurement | Puerto Rican | Eastern European |
| Minimum | 57.4% | 81.0% |
| Maximum | 100.0% | 100.0% |
| Range | 42.6% | 19.0% |
| Mean | 84.5% | 96.7% |
| Median | 86.0% | 97.5% |
| Interquartile 25% (IQ1) | 80.2% | 95.4% |
| Interquartile 75% (IQ3) | 89.6% | 100.0% |
| Interquartile Range (IQR) | 9.5% | 4.6% |
| Standard Deviation (Sample) | 8.5% | 3.9% |
| Standard Deviation (Population) | 8.4% | 3.9% |
Similar Demographics by 12th Grade, No Diploma
Demographics Similar to Puerto Ricans by 12th Grade, No Diploma
In terms of 12th grade, no diploma, the demographic groups most similar to Puerto Ricans are Immigrants from Nicaragua (86.6%, a difference of 0.030%), Central American Indian (86.5%, a difference of 0.080%), Yuman (86.5%, a difference of 0.080%), Immigrants from Belize (87.0%, a difference of 0.49%), and Belizean (87.0%, a difference of 0.57%).
| Demographics | Rating | Rank | 12th Grade, No Diploma |
| Cape Verdeans | 0.0 /100 | #314 | Tragic 87.4% |
| Nicaraguans | 0.0 /100 | #315 | Tragic 87.3% |
| Apache | 0.0 /100 | #316 | Tragic 87.3% |
| Navajo | 0.0 /100 | #317 | Tragic 87.1% |
| Belizeans | 0.0 /100 | #318 | Tragic 87.0% |
| Immigrants | Belize | 0.0 /100 | #319 | Tragic 87.0% |
| Immigrants | Nicaragua | 0.0 /100 | #320 | Tragic 86.6% |
| Puerto Ricans | 0.0 /100 | #321 | Tragic 86.5% |
| Central American Indians | 0.0 /100 | #322 | Tragic 86.5% |
| Yuman | 0.0 /100 | #323 | Tragic 86.5% |
| Immigrants | Cabo Verde | 0.0 /100 | #324 | Tragic 85.8% |
| Mexican American Indians | 0.0 /100 | #325 | Tragic 85.7% |
| Dominicans | 0.0 /100 | #326 | Tragic 85.7% |
| Lumbee | 0.0 /100 | #327 | Tragic 85.7% |
| Hondurans | 0.0 /100 | #328 | Tragic 85.5% |
Demographics Similar to Eastern Europeans by 12th Grade, No Diploma
In terms of 12th grade, no diploma, the demographic groups most similar to Eastern Europeans are Polish (93.5%, a difference of 0.010%), Danish (93.5%, a difference of 0.020%), Bulgarian (93.5%, a difference of 0.040%), Croatian (93.5%, a difference of 0.060%), and Latvian (93.6%, a difference of 0.090%).
| Demographics | Rating | Rank | 12th Grade, No Diploma |
| Carpatho Rusyns | 100.0 /100 | #5 | Exceptional 93.6% |
| Immigrants | India | 100.0 /100 | #6 | Exceptional 93.6% |
| Slovaks | 100.0 /100 | #7 | Exceptional 93.6% |
| Chinese | 100.0 /100 | #8 | Exceptional 93.6% |
| Latvians | 100.0 /100 | #9 | Exceptional 93.6% |
| Croatians | 100.0 /100 | #10 | Exceptional 93.5% |
| Poles | 100.0 /100 | #11 | Exceptional 93.5% |
| Eastern Europeans | 100.0 /100 | #12 | Exceptional 93.5% |
| Danes | 100.0 /100 | #13 | Exceptional 93.5% |
| Bulgarians | 100.0 /100 | #14 | Exceptional 93.5% |
| Finns | 100.0 /100 | #15 | Exceptional 93.4% |
| Maltese | 100.0 /100 | #16 | Exceptional 93.3% |
| Luxembourgers | 100.0 /100 | #17 | Exceptional 93.3% |
| Immigrants | Singapore | 99.9 /100 | #18 | Exceptional 93.3% |
| Germans | 99.9 /100 | #19 | Exceptional 93.3% |