Bermudan vs Bahamian 6th Grade
COMPARE
Bermudan
Bahamian
6th Grade
6th Grade Comparison
Bermudans
Bahamians
97.1%
6TH GRADE
52.6/ 100
METRIC RATING
169th/ 347
METRIC RANK
96.7%
6TH GRADE
4.8/ 100
METRIC RATING
223rd/ 347
METRIC RANK
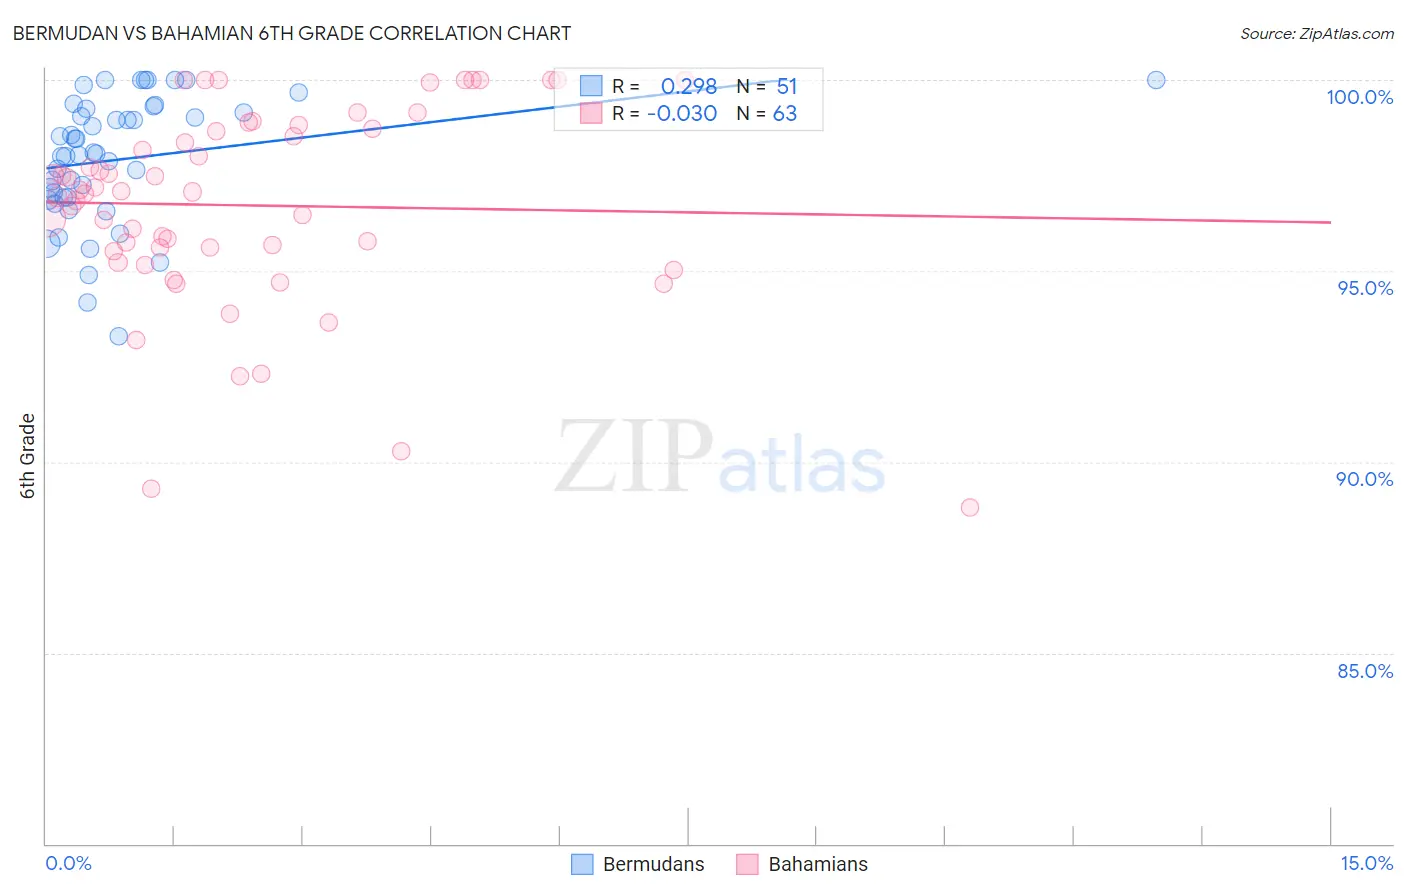
Bermudan vs Bahamian 6th Grade Correlation Chart
The statistical analysis conducted on geographies consisting of 55,721,975 people shows a weak positive correlation between the proportion of Bermudans and percentage of population with at least 6th grade education in the United States with a correlation coefficient (R) of 0.298 and weighted average of 97.1%. Similarly, the statistical analysis conducted on geographies consisting of 112,698,819 people shows no correlation between the proportion of Bahamians and percentage of population with at least 6th grade education in the United States with a correlation coefficient (R) of -0.030 and weighted average of 96.7%, a difference of 0.36%.
6th Grade Correlation Summary
| Measurement | Bermudan | Bahamian |
| Minimum | 93.3% | 88.8% |
| Maximum | 100.0% | 100.0% |
| Range | 6.7% | 11.2% |
| Mean | 97.9% | 96.7% |
| Median | 98.1% | 97.1% |
| Interquartile 25% (IQ1) | 96.9% | 95.5% |
| Interquartile 75% (IQ3) | 99.2% | 98.7% |
| Interquartile Range (IQR) | 2.3% | 3.2% |
| Standard Deviation (Sample) | 1.6% | 2.6% |
| Standard Deviation (Population) | 1.6% | 2.6% |
Similar Demographics by 6th Grade
Demographics Similar to Bermudans by 6th Grade
In terms of 6th grade, the demographic groups most similar to Bermudans are Apache (97.1%, a difference of 0.0%), Immigrants from Taiwan (97.1%, a difference of 0.0%), Chilean (97.1%, a difference of 0.0%), Immigrants from Sri Lanka (97.1%, a difference of 0.0%), and Immigrants from Italy (97.1%, a difference of 0.010%).
| Demographics | Rating | Rank | 6th Grade |
| Marshallese | 60.2 /100 | #162 | Good 97.1% |
| Albanians | 57.8 /100 | #163 | Average 97.1% |
| Immigrants | Korea | 57.7 /100 | #164 | Average 97.1% |
| Immigrants | Poland | 56.2 /100 | #165 | Average 97.1% |
| Immigrants | Italy | 53.8 /100 | #166 | Average 97.1% |
| Apache | 53.6 /100 | #167 | Average 97.1% |
| Immigrants | Taiwan | 53.5 /100 | #168 | Average 97.1% |
| Bermudans | 52.6 /100 | #169 | Average 97.1% |
| Chileans | 52.1 /100 | #170 | Average 97.1% |
| Immigrants | Sri Lanka | 51.7 /100 | #171 | Average 97.1% |
| Egyptians | 50.9 /100 | #172 | Average 97.1% |
| Arabs | 50.1 /100 | #173 | Average 97.0% |
| Venezuelans | 50.0 /100 | #174 | Average 97.0% |
| Immigrants | Kazakhstan | 47.3 /100 | #175 | Average 97.0% |
| Immigrants | Micronesia | 47.1 /100 | #176 | Average 97.0% |
Demographics Similar to Bahamians by 6th Grade
In terms of 6th grade, the demographic groups most similar to Bahamians are Immigrants from Southern Europe (96.7%, a difference of 0.010%), Immigrants from Pakistan (96.7%, a difference of 0.010%), Immigrants from Panama (96.7%, a difference of 0.010%), Immigrants from Western Asia (96.7%, a difference of 0.020%), and Immigrants from Malaysia (96.7%, a difference of 0.020%).
| Demographics | Rating | Rank | 6th Grade |
| Paiute | 7.8 /100 | #216 | Tragic 96.8% |
| Liberians | 7.5 /100 | #217 | Tragic 96.8% |
| Navajo | 7.3 /100 | #218 | Tragic 96.8% |
| Costa Ricans | 6.8 /100 | #219 | Tragic 96.8% |
| Immigrants | Morocco | 6.2 /100 | #220 | Tragic 96.7% |
| Tongans | 6.1 /100 | #221 | Tragic 96.7% |
| Immigrants | Syria | 5.9 /100 | #222 | Tragic 96.7% |
| Bahamians | 4.8 /100 | #223 | Tragic 96.7% |
| Immigrants | Southern Europe | 4.4 /100 | #224 | Tragic 96.7% |
| Immigrants | Pakistan | 4.4 /100 | #225 | Tragic 96.7% |
| Immigrants | Panama | 4.2 /100 | #226 | Tragic 96.7% |
| Immigrants | Western Asia | 4.1 /100 | #227 | Tragic 96.7% |
| Immigrants | Malaysia | 4.0 /100 | #228 | Tragic 96.7% |
| Assyrians/Chaldeans/Syriacs | 4.0 /100 | #229 | Tragic 96.7% |
| Immigrants | Eastern Asia | 4.0 /100 | #230 | Tragic 96.7% |