Pueblo vs Laotian 12th Grade, No Diploma
COMPARE
Pueblo
Laotian
12th Grade, No Diploma
12th Grade, No Diploma Comparison
Pueblo
Laotians
88.2%
12TH GRADE, NO DIPLOMA
0.0/ 100
METRIC RATING
297th/ 347
METRIC RANK
91.3%
12TH GRADE, NO DIPLOMA
64.4/ 100
METRIC RATING
159th/ 347
METRIC RANK
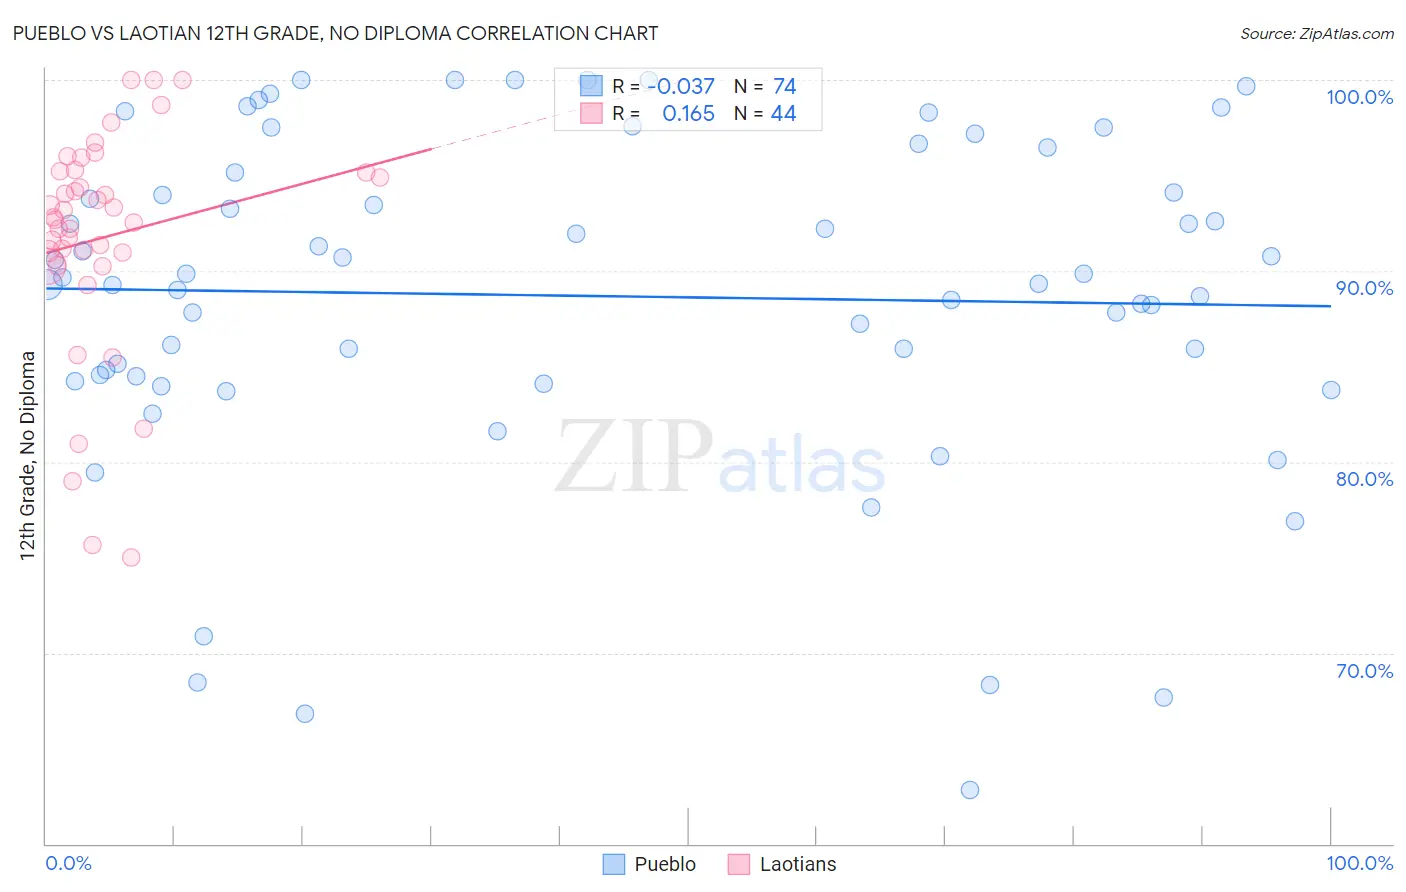
Pueblo vs Laotian 12th Grade, No Diploma Correlation Chart
The statistical analysis conducted on geographies consisting of 120,086,593 people shows no correlation between the proportion of Pueblo and percentage of population with at least 12th grade (no diploma) education in the United States with a correlation coefficient (R) of -0.037 and weighted average of 88.2%. Similarly, the statistical analysis conducted on geographies consisting of 224,854,130 people shows a poor positive correlation between the proportion of Laotians and percentage of population with at least 12th grade (no diploma) education in the United States with a correlation coefficient (R) of 0.165 and weighted average of 91.3%, a difference of 3.6%.
12th Grade, No Diploma Correlation Summary
| Measurement | Pueblo | Laotian |
| Minimum | 62.8% | 75.0% |
| Maximum | 100.0% | 100.0% |
| Range | 37.2% | 25.0% |
| Mean | 88.7% | 91.7% |
| Median | 89.5% | 92.7% |
| Interquartile 25% (IQ1) | 84.5% | 90.6% |
| Interquartile 75% (IQ3) | 95.1% | 95.2% |
| Interquartile Range (IQR) | 10.7% | 4.6% |
| Standard Deviation (Sample) | 8.7% | 5.8% |
| Standard Deviation (Population) | 8.7% | 5.8% |
Similar Demographics by 12th Grade, No Diploma
Demographics Similar to Pueblo by 12th Grade, No Diploma
In terms of 12th grade, no diploma, the demographic groups most similar to Pueblo are Fijian (88.2%, a difference of 0.010%), Immigrants (88.2%, a difference of 0.030%), Immigrants from Haiti (88.2%, a difference of 0.050%), Guyanese (88.3%, a difference of 0.070%), and Nepalese (88.1%, a difference of 0.10%).
| Demographics | Rating | Rank | 12th Grade, No Diploma |
| British West Indians | 0.0 /100 | #290 | Tragic 88.5% |
| Haitians | 0.0 /100 | #291 | Tragic 88.5% |
| Immigrants | Grenada | 0.0 /100 | #292 | Tragic 88.4% |
| Japanese | 0.0 /100 | #293 | Tragic 88.3% |
| Guyanese | 0.0 /100 | #294 | Tragic 88.3% |
| Immigrants | Immigrants | 0.0 /100 | #295 | Tragic 88.2% |
| Fijians | 0.0 /100 | #296 | Tragic 88.2% |
| Pueblo | 0.0 /100 | #297 | Tragic 88.2% |
| Immigrants | Haiti | 0.0 /100 | #298 | Tragic 88.2% |
| Nepalese | 0.0 /100 | #299 | Tragic 88.1% |
| Immigrants | Guyana | 0.0 /100 | #300 | Tragic 88.1% |
| Immigrants | Cambodia | 0.0 /100 | #301 | Tragic 88.1% |
| Ecuadorians | 0.0 /100 | #302 | Tragic 88.0% |
| Immigrants | Bangladesh | 0.0 /100 | #303 | Tragic 88.0% |
| Vietnamese | 0.0 /100 | #304 | Tragic 87.9% |
Demographics Similar to Laotians by 12th Grade, No Diploma
In terms of 12th grade, no diploma, the demographic groups most similar to Laotians are Immigrants from Albania (91.3%, a difference of 0.0%), Immigrants from Hong Kong (91.3%, a difference of 0.010%), Immigrants from Northern Africa (91.4%, a difference of 0.020%), Brazilian (91.3%, a difference of 0.030%), and Immigrants from Asia (91.3%, a difference of 0.040%).
| Demographics | Rating | Rank | 12th Grade, No Diploma |
| Kenyans | 77.4 /100 | #152 | Good 91.5% |
| Iraqis | 75.3 /100 | #153 | Good 91.5% |
| Immigrants | Kenya | 73.9 /100 | #154 | Good 91.5% |
| Immigrants | Iraq | 73.0 /100 | #155 | Good 91.4% |
| Asians | 71.9 /100 | #156 | Good 91.4% |
| Immigrants | Pakistan | 70.7 /100 | #157 | Good 91.4% |
| Immigrants | Northern Africa | 66.2 /100 | #158 | Good 91.4% |
| Laotians | 64.4 /100 | #159 | Good 91.3% |
| Immigrants | Albania | 64.1 /100 | #160 | Good 91.3% |
| Immigrants | Hong Kong | 63.8 /100 | #161 | Good 91.3% |
| Brazilians | 62.0 /100 | #162 | Good 91.3% |
| Immigrants | Asia | 61.5 /100 | #163 | Good 91.3% |
| Immigrants | China | 60.9 /100 | #164 | Good 91.3% |
| Alsatians | 58.3 /100 | #165 | Average 91.3% |
| Hmong | 58.0 /100 | #166 | Average 91.3% |