Haitian vs Immigrants from Cuba 12th Grade, No Diploma
COMPARE
Haitian
Immigrants from Cuba
12th Grade, No Diploma
12th Grade, No Diploma Comparison
Haitians
Immigrants from Cuba
88.5%
12TH GRADE, NO DIPLOMA
0.0/ 100
METRIC RATING
291st/ 347
METRIC RANK
87.5%
12TH GRADE, NO DIPLOMA
0.0/ 100
METRIC RATING
310th/ 347
METRIC RANK
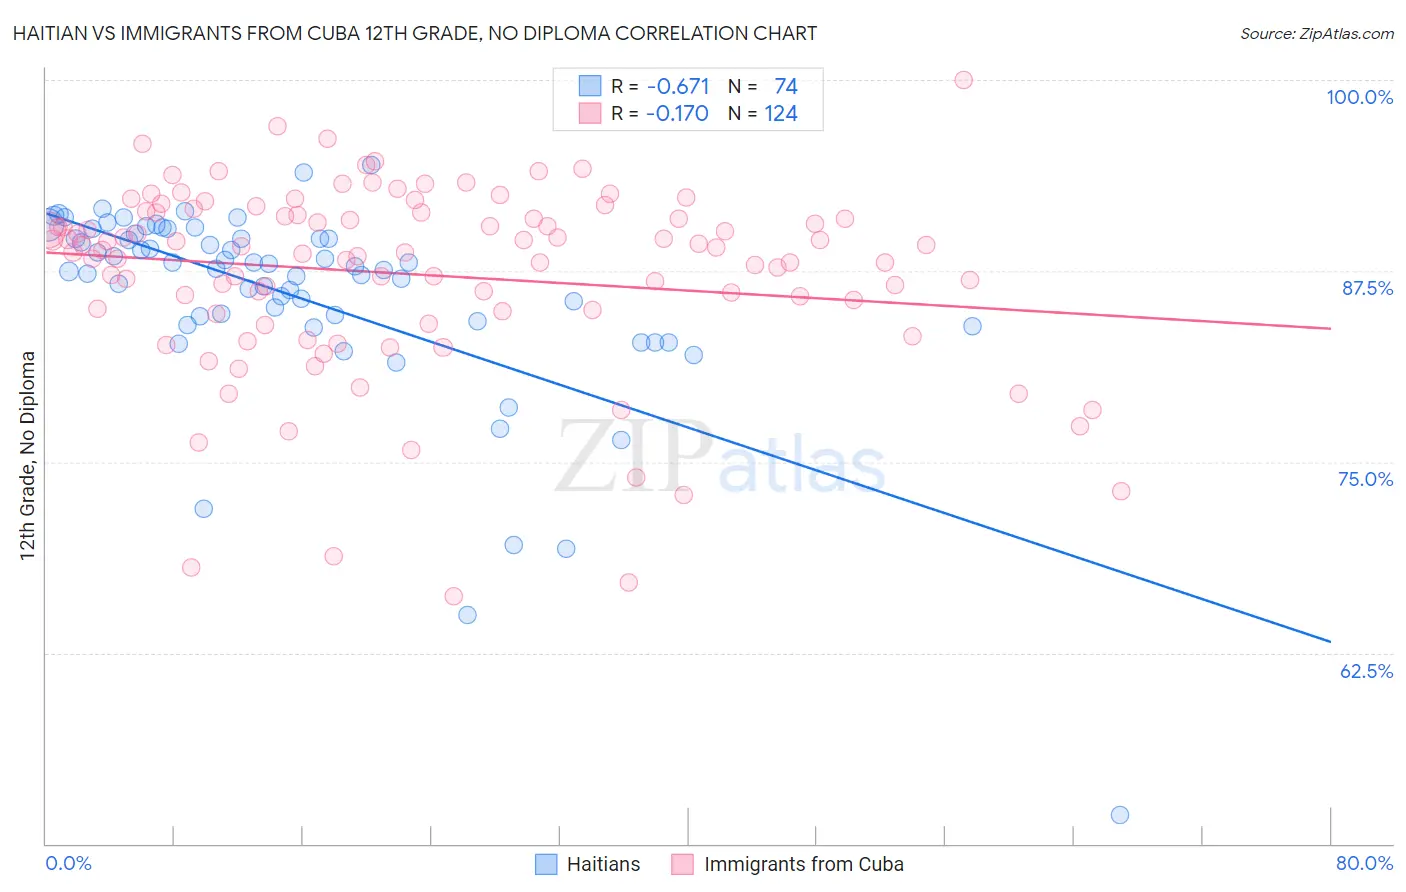
Haitian vs Immigrants from Cuba 12th Grade, No Diploma Correlation Chart
The statistical analysis conducted on geographies consisting of 288,018,742 people shows a significant negative correlation between the proportion of Haitians and percentage of population with at least 12th grade (no diploma) education in the United States with a correlation coefficient (R) of -0.671 and weighted average of 88.5%. Similarly, the statistical analysis conducted on geographies consisting of 326,028,015 people shows a poor negative correlation between the proportion of Immigrants from Cuba and percentage of population with at least 12th grade (no diploma) education in the United States with a correlation coefficient (R) of -0.170 and weighted average of 87.5%, a difference of 1.2%.
12th Grade, No Diploma Correlation Summary
| Measurement | Haitian | Immigrants from Cuba |
| Minimum | 51.9% | 66.2% |
| Maximum | 94.5% | 100.0% |
| Range | 42.5% | 33.8% |
| Mean | 85.8% | 87.3% |
| Median | 87.7% | 89.0% |
| Interquartile 25% (IQ1) | 84.2% | 84.9% |
| Interquartile 75% (IQ3) | 89.6% | 91.3% |
| Interquartile Range (IQR) | 5.4% | 6.4% |
| Standard Deviation (Sample) | 6.8% | 6.2% |
| Standard Deviation (Population) | 6.7% | 6.2% |
Demographics Similar to Haitians and Immigrants from Cuba by 12th Grade, No Diploma
In terms of 12th grade, no diploma, the demographic groups most similar to Haitians are British West Indian (88.5%, a difference of 0.0%), Immigrants from Grenada (88.4%, a difference of 0.17%), Japanese (88.3%, a difference of 0.26%), Guyanese (88.3%, a difference of 0.32%), and Immigrants (88.2%, a difference of 0.36%). Similarly, the demographic groups most similar to Immigrants from Cuba are Immigrants from Armenia (87.6%, a difference of 0.050%), Yup'ik (87.6%, a difference of 0.080%), Immigrants from Portugal (87.6%, a difference of 0.12%), Native/Alaskan (87.7%, a difference of 0.16%), and Immigrants from Dominica (87.7%, a difference of 0.23%).
| Demographics | Rating | Rank | 12th Grade, No Diploma |
| British West Indians | 0.0 /100 | #290 | Tragic 88.5% |
| Haitians | 0.0 /100 | #291 | Tragic 88.5% |
| Immigrants | Grenada | 0.0 /100 | #292 | Tragic 88.4% |
| Japanese | 0.0 /100 | #293 | Tragic 88.3% |
| Guyanese | 0.0 /100 | #294 | Tragic 88.3% |
| Immigrants | Immigrants | 0.0 /100 | #295 | Tragic 88.2% |
| Fijians | 0.0 /100 | #296 | Tragic 88.2% |
| Pueblo | 0.0 /100 | #297 | Tragic 88.2% |
| Immigrants | Haiti | 0.0 /100 | #298 | Tragic 88.2% |
| Nepalese | 0.0 /100 | #299 | Tragic 88.1% |
| Immigrants | Guyana | 0.0 /100 | #300 | Tragic 88.1% |
| Immigrants | Cambodia | 0.0 /100 | #301 | Tragic 88.1% |
| Ecuadorians | 0.0 /100 | #302 | Tragic 88.0% |
| Immigrants | Bangladesh | 0.0 /100 | #303 | Tragic 88.0% |
| Vietnamese | 0.0 /100 | #304 | Tragic 87.9% |
| Immigrants | Dominica | 0.0 /100 | #305 | Tragic 87.7% |
| Natives/Alaskans | 0.0 /100 | #306 | Tragic 87.7% |
| Immigrants | Portugal | 0.0 /100 | #307 | Tragic 87.6% |
| Yup'ik | 0.0 /100 | #308 | Tragic 87.6% |
| Immigrants | Armenia | 0.0 /100 | #309 | Tragic 87.6% |
| Immigrants | Cuba | 0.0 /100 | #310 | Tragic 87.5% |